

#5559 closed bug (fixed)
Memory pressure causes high latency
| Reported by: | bbjimmy | Owned by: | bonefish |
|---|---|---|---|
| Priority: | normal | Milestone: | R1/alpha2 |
| Component: | System/Kernel | Version: | R1/Development |
| Keywords: | Cc: | ||
| Blocked By: | Blocking: | ||
| Platform: | All |
Description
Performing a jam on the haiku trunk with 479mb available ram and 997mb Virtual Memory swap file causes extreem latency issues after about 10 minutes of operation. Stopping the jsm job will not ease the latency issues. The activity monitor shows about 20% used memory, but the rest is devoted to cashed memory and I beleive the swap file is being constantly accessed ( constant disk activity, and remaining above 50% utilized.) This state will continue untill the system is re-booted. then the used memory will remain around 20%, but the cashed memory will not use the rest of available memory and the swap space remains below 20% usage.
This is 100% repeatable on hrev35788 and recent earlier revisions.
Increasing the swap file space makes the problem worse, not better.
decreasing the swap file space solves the issue, but leves not enough memory to jam the tree.
I believe Haiku is attempting to use virtual memory for cached memory and making the system unusable by constantly accessing the swap file.
Attachments (6)
Change History (24)
comment:1 by , 14 years ago
| Version: | R1/alpha1 → R1/Development |
|---|
comment:2 by , 14 years ago
| Owner: | changed from to |
|---|---|
| Status: | new → assigned |
follow-up: 4 comment:3 by , 14 years ago
comment:5 by , 14 years ago
Replying to bbjimmy:
How do I do this?
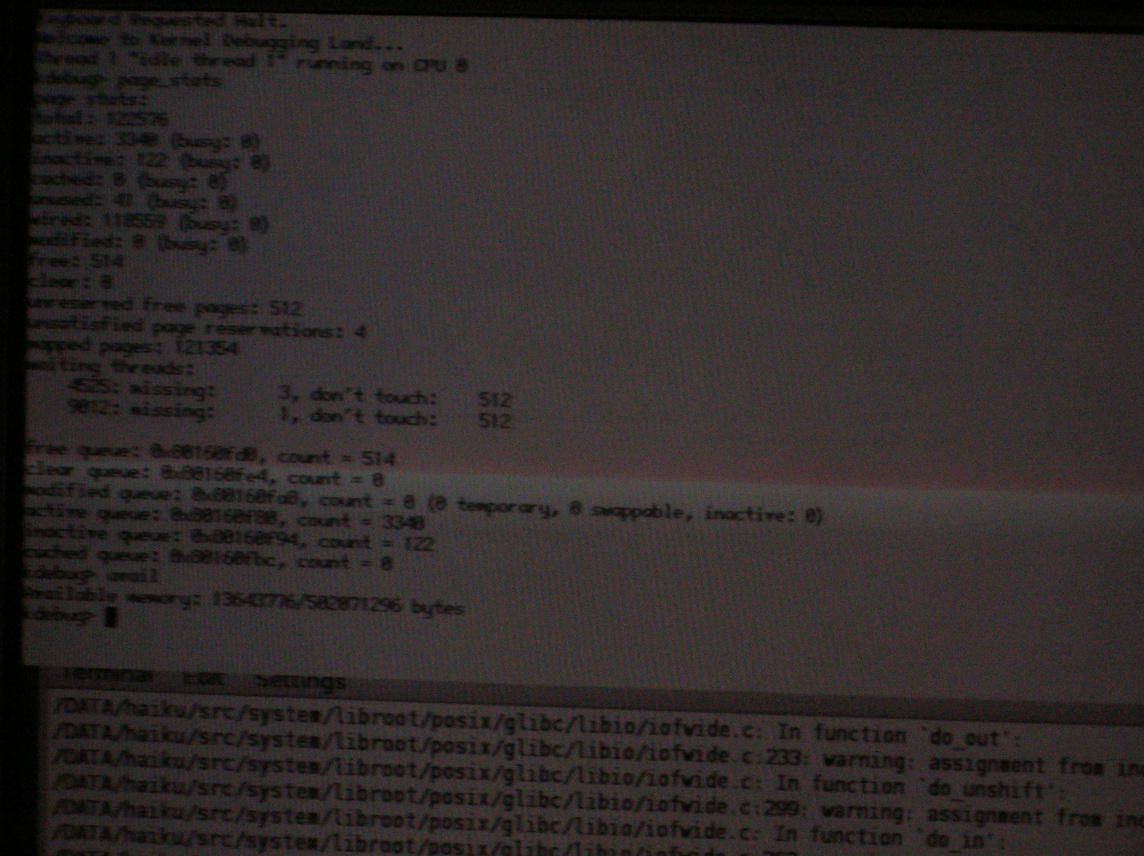
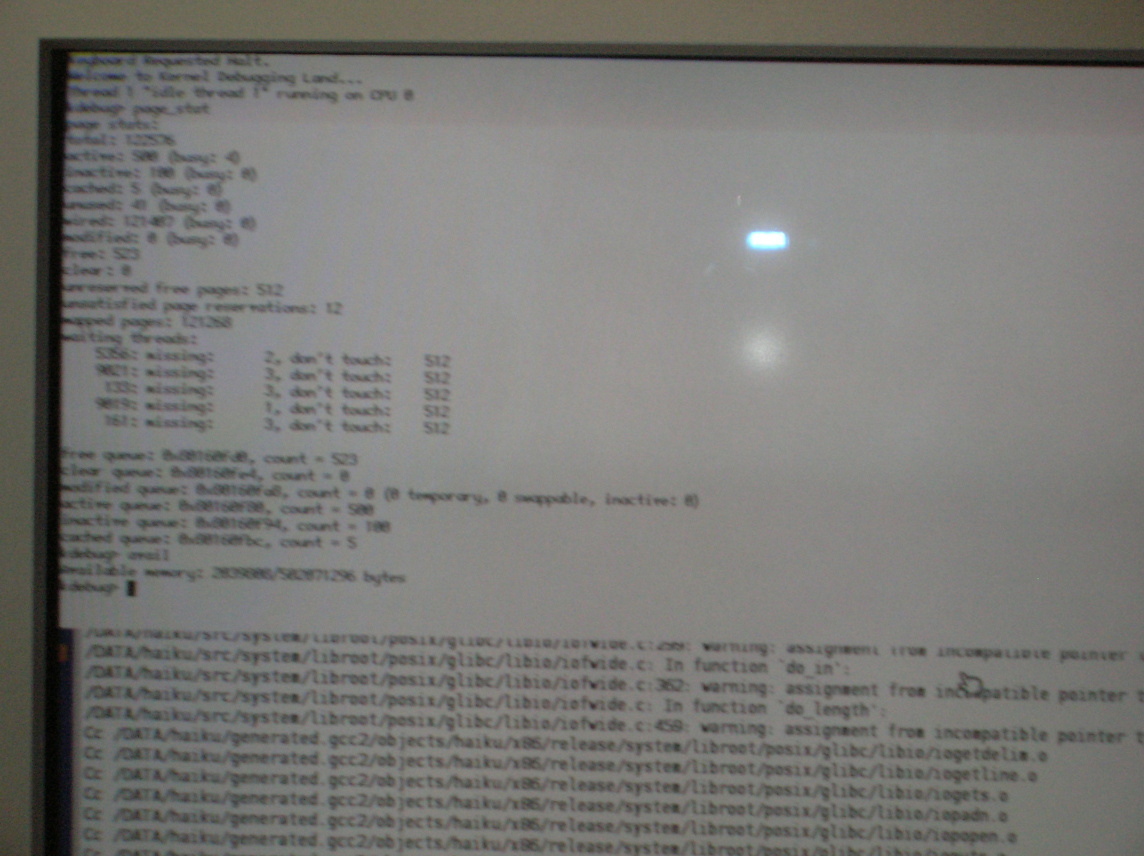
- Enter the kernel debugger via Alt-SysReq-D. You will be greeted with a prompt that allows you to enter commands.
- Execute "page_stats".
- Execute "avail".
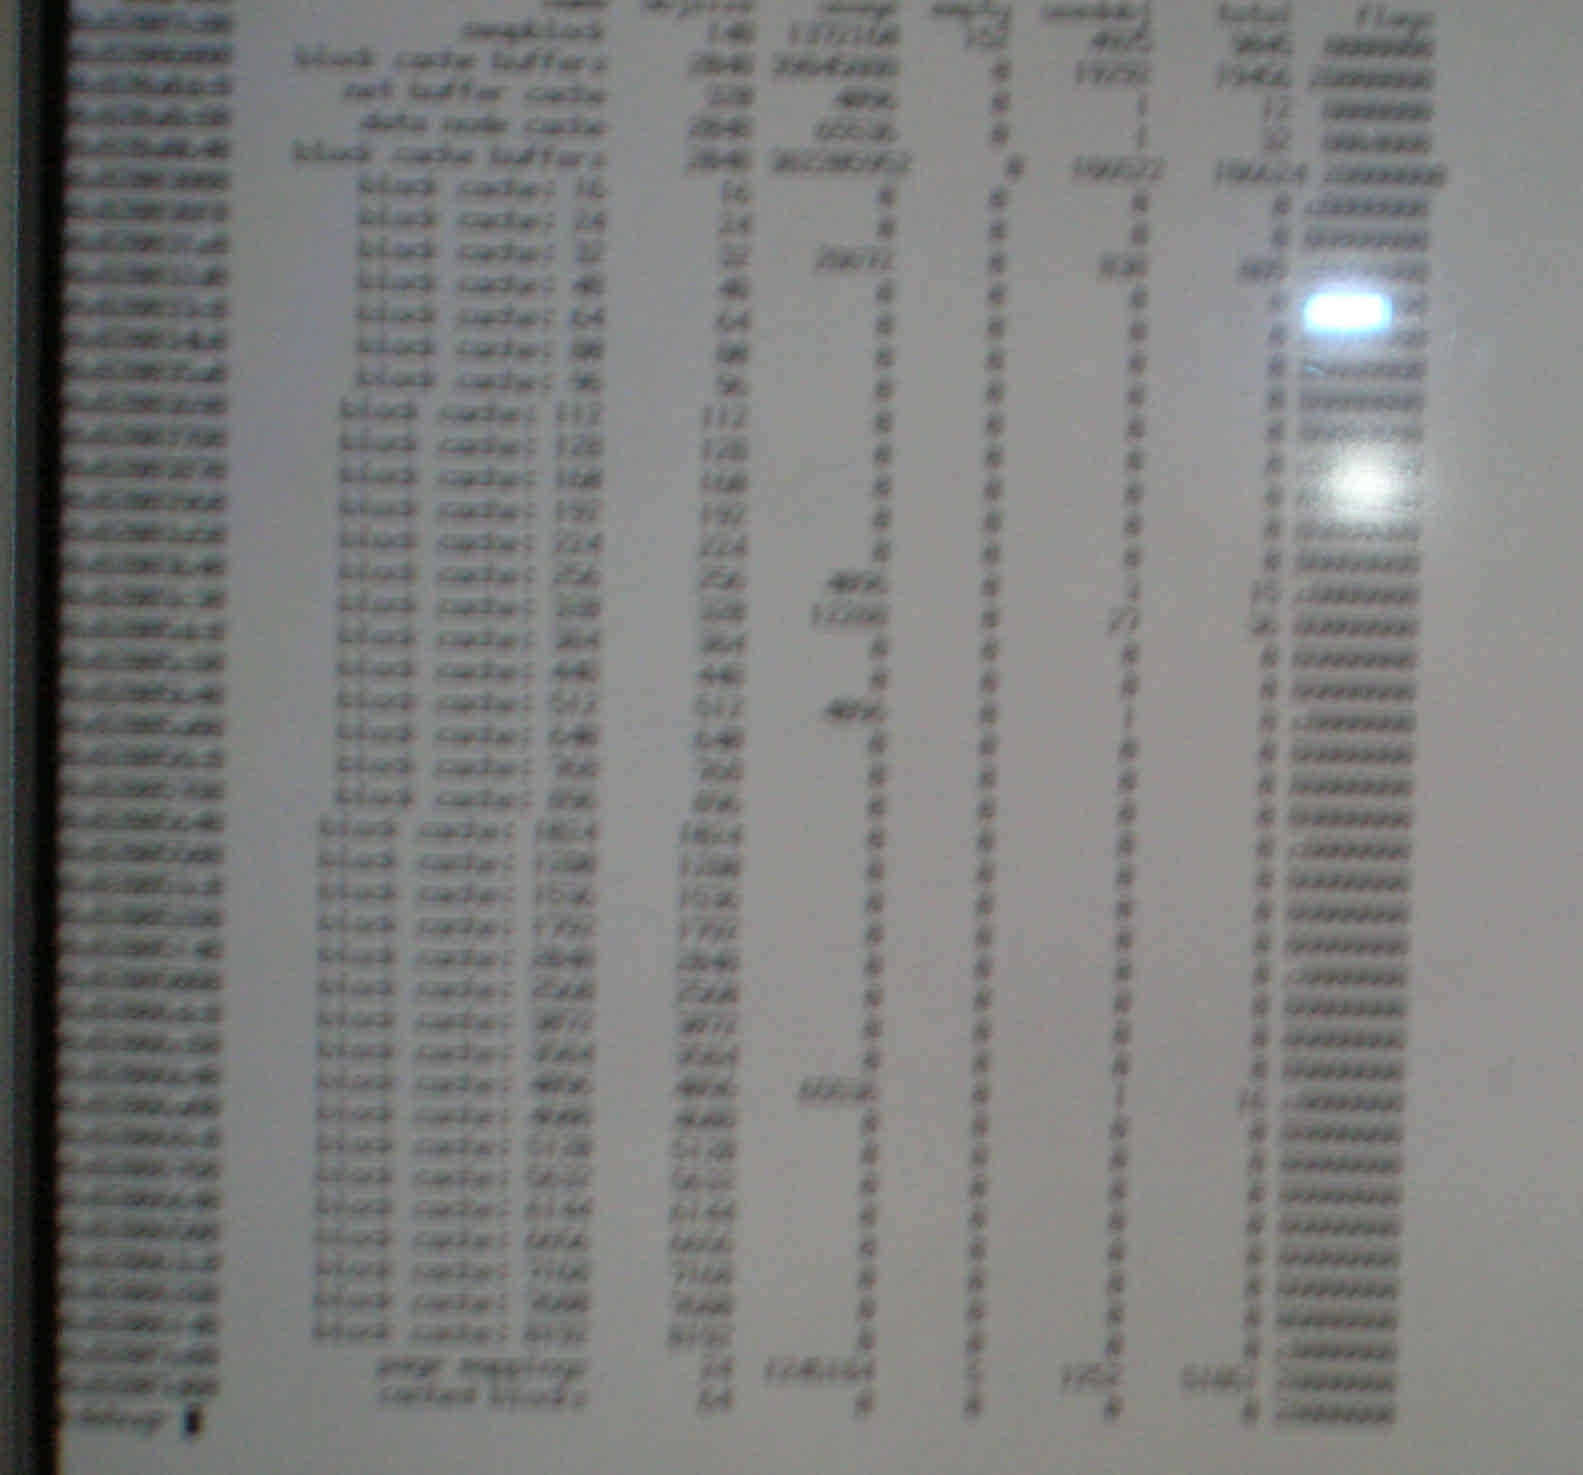
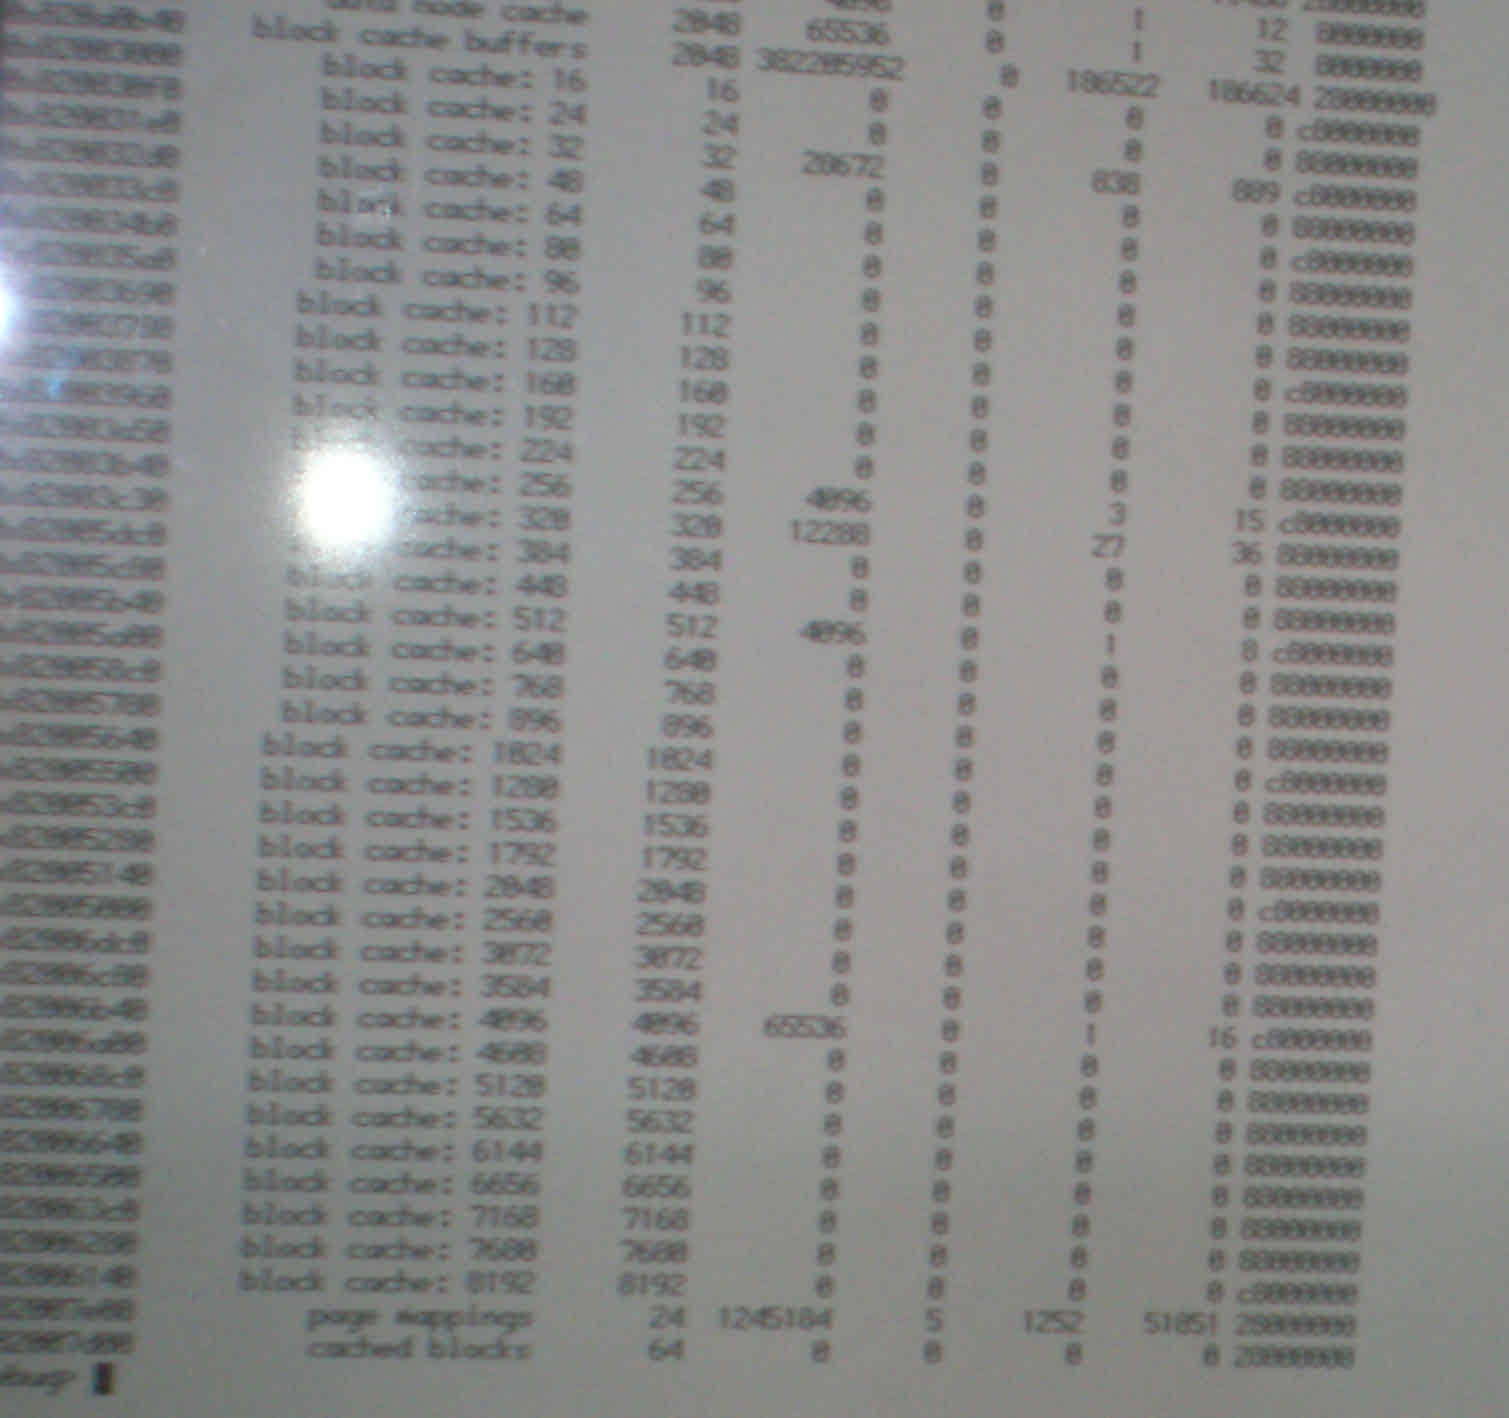
- The output of the "slabs" command might be interesting, too. It will be longer and might overwrite previous output on screen.
If you have a serial port and a second machine you can connect it to, you can capture the output this way (configuration: 115200 8N1). Alternatively take a picture of the output.
comment:6 by , 14 years ago
The image is from before the system became completely unresponsive. A short while later after continuing, the mouse cursor froze and the screen stopped updating.
comment:7 by , 14 years ago
The "page_stats" output confirms that the system is actively paging. All pages (save for a small system reserve) are in use, none are cached. "avail" basically agrees. Someone has allocated lots of memory and from the looks of it it is some kernel component. The output of "slabs" would be helpful as well as the output of "areas 1".
comment:9 by , 14 years ago
| Owner: | changed from to |
|---|
Something seems to be wrong with the block cache. It eats up 380 MB. Handing the ticket over to Axel.
comment:11 by , 14 years ago
The block cache itself is unlikely to be the problem, though. Anyway, can you add the following debug output when this happens:
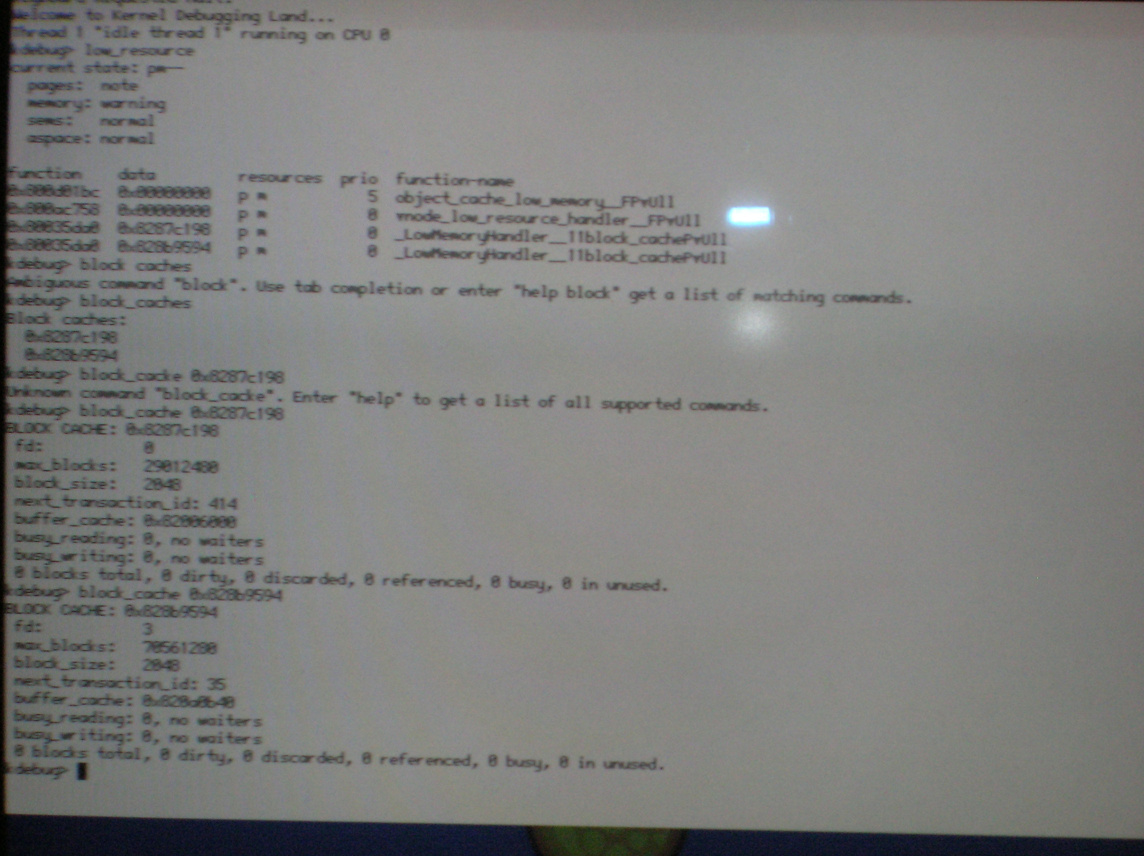
- low_resource
- block_caches
- And then "block_cache <address>" with the addresses you got from the previous command? (the output of block_caches itself isn't interesting)
Thanks!
comment:13 by , 14 years ago
So the block caches think they don't have any blocks anymore while the "block cache buffers" object caches still has lots of allocated objects (DSCN1482.JPG). Interestingly the "cached blocks" object cache is empty, too. Also interesting: The slabs listing doesn't start with "block cache: 16", which means the low resource manager is currently working on the object caches. More precisely, it doesn't seem to be done with "cached blocks" yet.
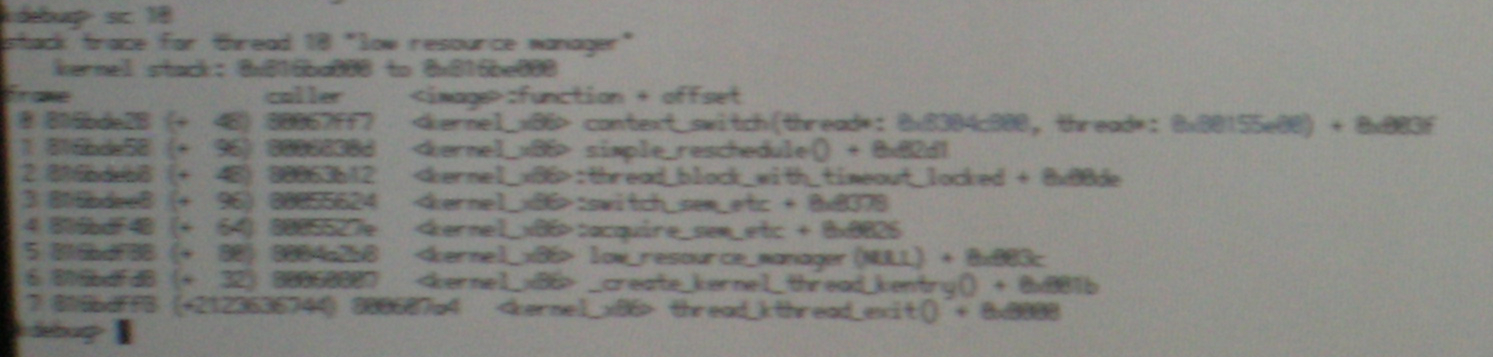
bbjimmy, can you get a stack trace of the "low resource manager" thread please. I.e. check with "threads 1" which ID it has and then run "sc <id>".
follow-up: 16 comment:14 by , 14 years ago
While I looked over it several times already, I wouldn't rule out a memory leak in the block cache. I also have seen a "cache still has partial slabs" panic on unmounting BFS recently which might hint into that direction, too.
comment:15 by , 14 years ago
Since it isn't running this time, it was probably just a coincidence it did before. So I would assume there has to be a leak in the block cache.
Thanks for being so helpful, bbjimmy, it's really appreciated!
comment:16 by , 14 years ago
| Owner: | changed from to |
|---|---|
| Status: | assigned → in-progress |
Replying to axeld:
While I looked over it several times already, I wouldn't rule out a memory leak in the block cache. I also have seen a "cache still has partial slabs" panic on unmounting BFS recently which might hint into that direction, too.
I can reproduce this panic on unmounting a ReiserFS volume after a larger recursive grep (with limited RAM). I've already verified that all block_cache_get() calls are balanced by block_cache_put()s. Apparently an issue in the low resource handler of the block cache or the slab. Will have a look.
comment:17 by , 14 years ago
| Resolution: | → fixed |
|---|---|
| Status: | in-progress → closed |
Should be fixed in hrev35918. Please reopen, if you can still reproduce the problem.
comment:18 by , 14 years ago
Imdeed this seems to have fixed the issue. The block cache is staying about mb and not continually growing during the jam.
Failed to reproduce with 512 MB RAM on my Core i7, hrev35799. The build just completed normally after 34 min.
Please provide more information from within the kernel debugger. The output of "page_stats" and "avail" commands would be of interest.