

#10249 closed bug (fixed)
Haiku built from Haiku doesn't boot without disabling SMP or NX-bit
| Reported by: | pulkomandy | Owned by: | bonefish |
|---|---|---|---|
| Priority: | normal | Milestone: | R1 |
| Component: | System/Kernel | Version: | R1/Development |
| Keywords: | vm | Cc: | humdinger |
| Blocked By: | Blocking: | ||
| Platform: | All |
Description (last modified by )
This happened somewhere between hrev46412 and hrev46447. I now have to disable SMP in the boot menu, else the system freezes somewhere between 3rd and 4th icon.
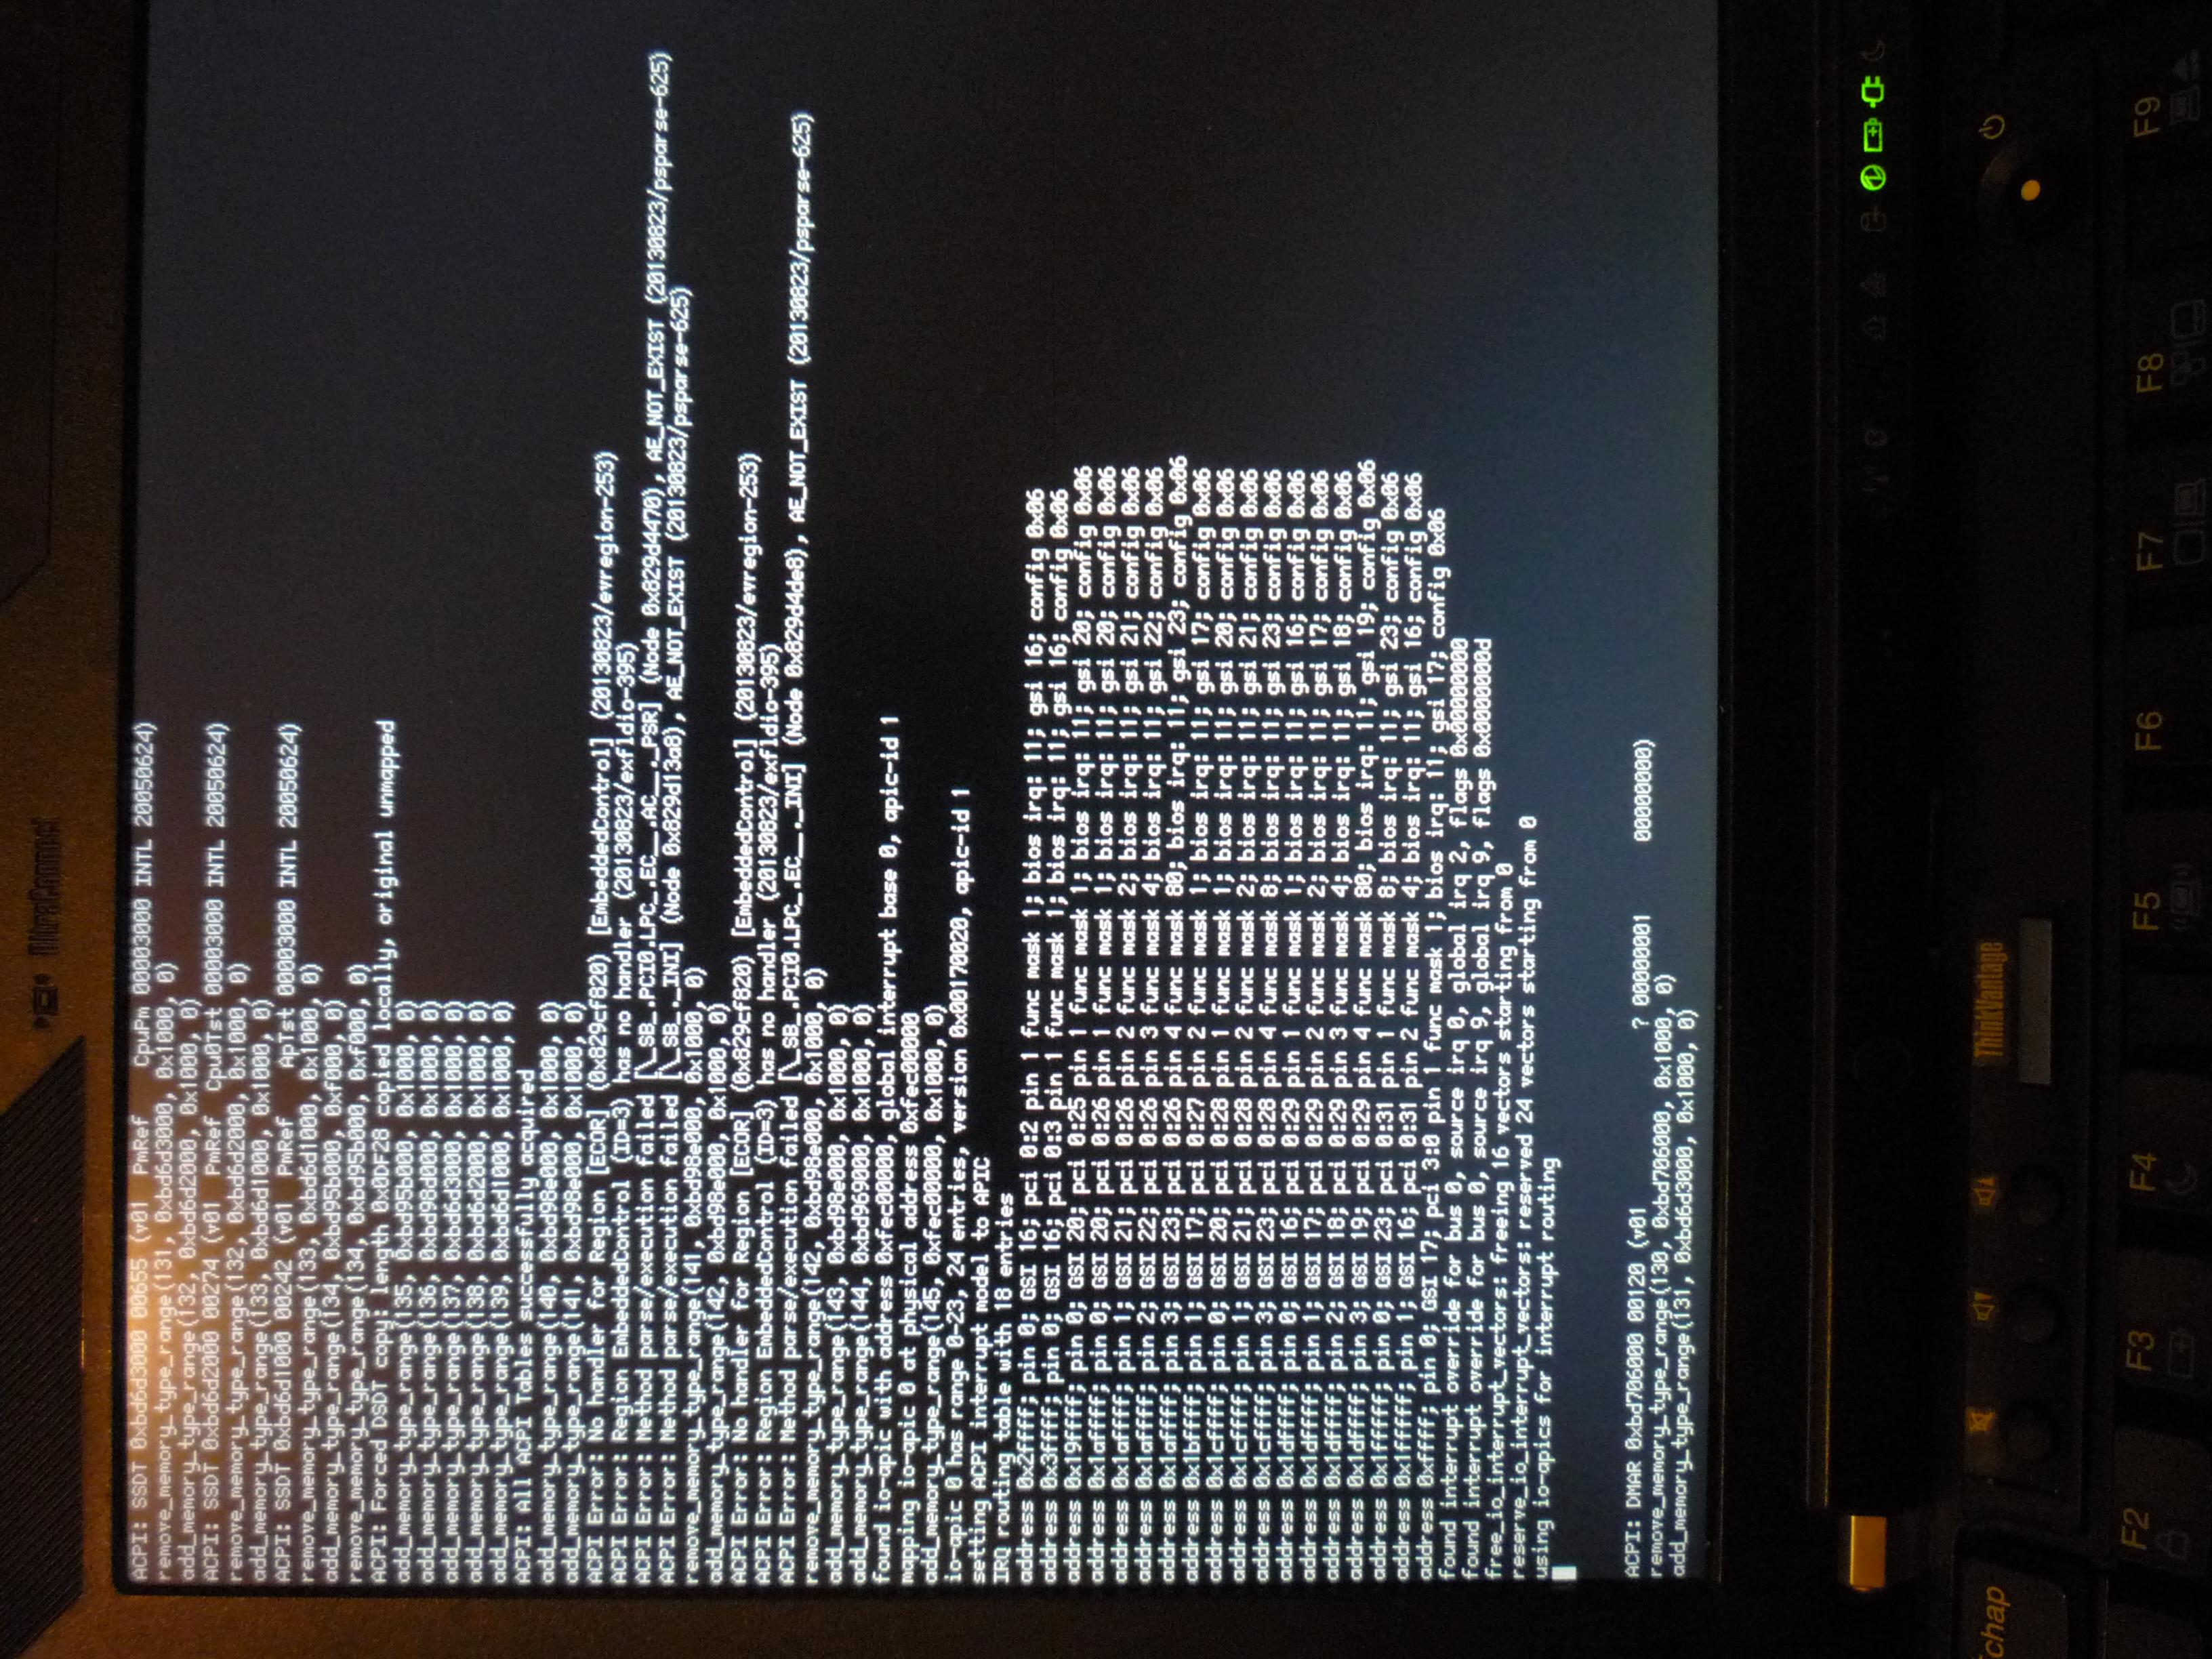
On-screen debug last message is about using the IO-APIC, but I tried disabling that and not using it crashes much earlier.
Nightly builds are still working. I tried doing a clean build (even re-ran configure and everything) without success.
Arfonzo is getting similar problems on VirtualBox, with a panic this time.
Further testing shows that disabling the NX-bit support in the BIOS makes it work for me.
Attachments (19)
Change History (80)
comment:1 by , 10 years ago
| Resolution: | → invalid |
|---|---|
| Status: | new → closed |
comment:2 by , 10 years ago
| Description: | modified (diff) |
|---|---|
| Resolution: | invalid |
| Status: | closed → reopened |
| Summary: | Haiku doesn't boot with SMP enabled on Thinkpad X200. → Haiku built from Haiku doesn't boot without disabling SMP |
comment:3 by , 10 years ago
JFYI, I see the same thing. Booting stops, unless I choose "Disable local APIC" in the boot options. Haven't tried disabling SMP though.
comment:5 by , 10 years ago
If it can help, I have added two serial debug files. One with SMP disabled and the other one without.
Hope this helps.
comment:6 by , 10 years ago
Listdev for my computer:
~> listdev

device Serial bus controller (SMBus) [c|5|0]
  vendor 8086: Intel Corporation
  device 2930: 82801I (ICH9 Family) SMBus Controller

device Mass storage controller (SATA controller, AHCI 1.0) [1|6|1]
  vendor 8086: Intel Corporation
  device 2929: 82801IBM/IEM (ICH9M/ICH9M-E) 4 port SATA Controller [AHCI mode]

device Bridge (ISA bridge) [6|1|0]
  vendor 8086: Intel Corporation
  device 2917: ICH9M-E LPC Interface Controller

device Bridge (PCI bridge, Subtractive decode) [6|4|1]
  vendor 8086: Intel Corporation
  device 2448: 82801 Mobile PCI Bridge

device Serial bus controller (USB controller, EHCI) [c|3|20]
  vendor 8086: Intel Corporation
  device 293a: 82801I (ICH9 Family) USB2 EHCI Controller #1

device Serial bus controller (USB controller, UHCI) [c|3|0]
  vendor 8086: Intel Corporation
  device 2936: 82801I (ICH9 Family) USB UHCI Controller #3

device Serial bus controller (USB controller, UHCI) [c|3|0]
  vendor 8086: Intel Corporation
  device 2935: 82801I (ICH9 Family) USB UHCI Controller #2

device Serial bus controller (USB controller, UHCI) [c|3|0]
  vendor 8086: Intel Corporation
  device 2934: 82801I (ICH9 Family) USB UHCI Controller #1

device Bridge (PCI bridge, Normal decode) [6|4|0]
  vendor 8086: Intel Corporation
  device 2946: 82801I (ICH9 Family) PCI Express Port 4

device Network controller [2|80|0]
  vendor 8086: Intel Corporation
  device 4236: Ultimate N WiFi Link 5300

device Bridge (PCI bridge, Normal decode) [6|4|0]
  vendor 8086: Intel Corporation
  device 2942: 82801I (ICH9 Family) PCI Express Port 2

device Bridge (PCI bridge, Normal decode) [6|4|0]
  vendor 8086: Intel Corporation
  device 2940: 82801I (ICH9 Family) PCI Express Port 1

device Multimedia controller (Audio device) [4|3|0]
  vendor 8086: Intel Corporation
  device 293e: 82801I (ICH9 Family) HD Audio Controller

device Serial bus controller (USB controller, EHCI) [c|3|20]
  vendor 8086: Intel Corporation
  device 293c: 82801I (ICH9 Family) USB2 EHCI Controller #2

device Serial bus controller (USB controller, UHCI) [c|3|0]
  vendor 8086: Intel Corporation
  device 2939: 82801I (ICH9 Family) USB UHCI Controller #6

device Serial bus controller (USB controller, UHCI) [c|3|0]
  vendor 8086: Intel Corporation
  device 2938: 82801I (ICH9 Family) USB UHCI Controller #5

device Serial bus controller (USB controller, UHCI) [c|3|0]
  vendor 8086: Intel Corporation
  device 2937: 82801I (ICH9 Family) USB UHCI Controller #4

device Network controller (Ethernet controller) [2|0|0]
  vendor 8086: Intel Corporation
  device 10f5: 82567LM Gigabit Network Connection

device Communication controller [7|80|0]
  vendor 8086: Intel Corporation
  device 2a44: Mobile 4 Series Chipset MEI Controller

device Display controller [3|80|0]
  vendor 8086: Intel Corporation
  device 2a43: Mobile 4 Series Chipset Integrated Graphics Controller

device Display controller (VGA compatible controller, VGA controller) [3|0|0]
  vendor 8086: Intel Corporation
  device 2a42: Mobile 4 Series Chipset Integrated Graphics Controller

device Bridge (Host bridge) [6|0|0]
  vendor 8086: Intel Corporation
  device 2a40: Mobile 4 Series Chipset Memory Controller Hub
And sysinfo:
~> sysinfo
Kernel name: kernel_x86 built on: Nov 26 2013 00:37:01 version 0x1
2 Intel Core 2, revision 467a running at 2394MHz (ID: 0x00000000 0x00000000)

CPU #0: "Intel(R) Core(TM)2 Duo CPU     P8600  @ 2.40GHz"
        Type 0, family 6, model 23, stepping 10, features 0xbfebfbff
                FPU VME DE PSE TSC MSR PAE MCE CX8 APIC SEP MTRR PGE MCA CMOV PAT
                PSE36 CFLUSH DS ACPI MMX FXSTR SSE SSE2 SS HTT TM PBE
        Extended Intel: 0x0408e3fd
                SSE3 DTES64 MONITOR DS-CPL VMX SMX EST TM2 SSSE3 CX16 xTPR PDCM SSE4.1 XSAVE
        Extended AMD: type 0, family 0, model 0, stepping 0, features 0x20100000
                NX 64
        Power Management Features:

        L2 Data cache fully associative, 1 lines/tag, 64 bytes/line
        L2 cache: 0 KB, 1-way set associative, 0 lines/tag, 63 bytes/line

        Inst TLB: 2M-bytes pages, 4-way set associative, 8 entries OR 4M, 4-way, 4 entries
        Inst TLB: 4K-bytes pages, 4-way set associative, 128 entries
        Data TLB: 4M-byte pages, 4-way set associative, 32 entries
        64-byte Prefetching
        L1 Data TLB: 4K-bytes pages, 4-way set associative, 16 entries
        L1 Data TLB: 4M-bytes pages, 4-way set associative, 16 entries
        L2 cache: 3072 KB, 12-way set associative, 64 bytes/line, unified on-die
        L1 inst cache: 32 KB, 8-way set associative, 64 bytes/line
        Data TLB: 4K-bytes pages, 4-way set associative, 256 entries
        L1 data cache: 32 KB, 8-way set associative, 64 bytes/line

CPU #1: "Intel(R) Core(TM)2 Duo CPU     P8600  @ 2.40GHz"
        Type 0, family 6, model 23, stepping 10, features 0xbfebfbff
                FPU VME DE PSE TSC MSR PAE MCE CX8 APIC SEP MTRR PGE MCA CMOV PAT
                PSE36 CFLUSH DS ACPI MMX FXSTR SSE SSE2 SS HTT TM PBE
        Extended Intel: 0x0408e3fd
                SSE3 DTES64 MONITOR DS-CPL VMX SMX EST TM2 SSSE3 CX16 xTPR PDCM SSE4.1 XSAVE
        Extended AMD: type 0, family 0, model 0, stepping 0, features 0x20100000
                NX 64
        Power Management Features:

        L2 Data cache fully associative, 1 lines/tag, 64 bytes/line
        L2 cache: 0 KB, 1-way set associative, 0 lines/tag, 63 bytes/line

        Inst TLB: 2M-bytes pages, 4-way set associative, 8 entries OR 4M, 4-way, 4 entries
        Inst TLB: 4K-bytes pages, 4-way set associative, 128 entries
        Data TLB: 4M-byte pages, 4-way set associative, 32 entries
        64-byte Prefetching
        L1 Data TLB: 4K-bytes pages, 4-way set associative, 16 entries
        L1 Data TLB: 4M-bytes pages, 4-way set associative, 16 entries
        L2 cache: 3072 KB, 12-way set associative, 64 bytes/line, unified on-die
        L1 inst cache: 32 KB, 8-way set associative, 64 bytes/line
        Data TLB: 4K-bytes pages, 4-way set associative, 256 entries
        L1 data cache: 32 KB, 8-way set associative, 64 bytes/line

8003596288 bytes free      (used/max  474566656 / 8478162944)
                           (cached    711921664)
     63327 semaphores free (used/max       2209 /      65536)
      3727 ports free      (used/max        369 /       4096)
      3831 threads free    (used/max        265 /       4096)
      2019 teams free      (used/max         29 /       2048)
comment:7 by , 10 years ago
| Description: | modified (diff) |
|---|---|
| Summary: | Haiku built from Haiku doesn't boot without disabling SMP → Haiku built from Haiku doesn't boot without disabling SMP or NX-bit |
comment:10 by , 10 years ago
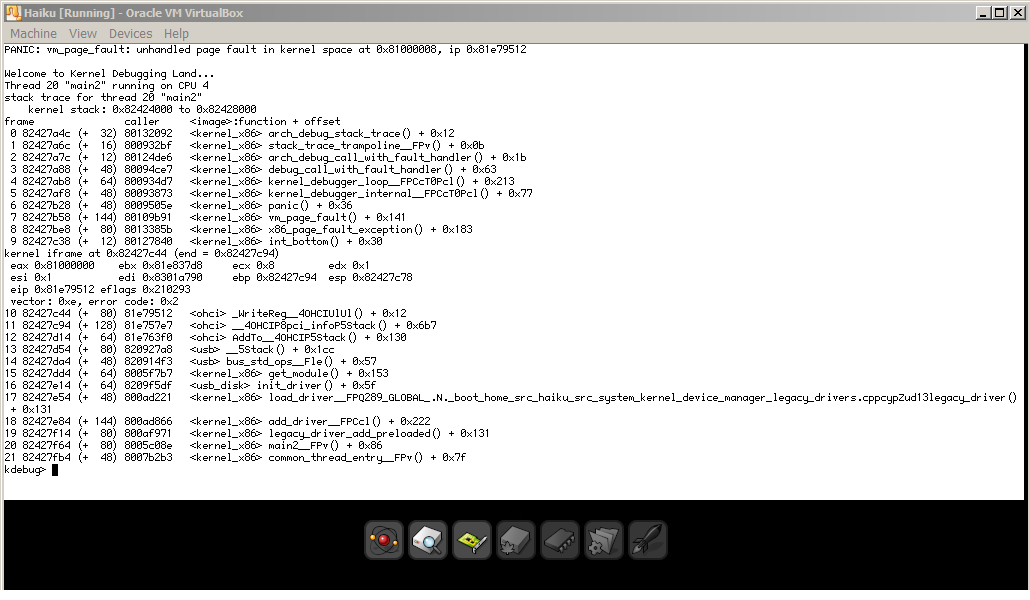
Using a vmdk built by PulkoMandy, VirtualBox panics at the third icon when the VM has two CPUs. A VBox VM with only one CPU boots fine. Serial output from the 2-CPU crash attached.
by , 10 years ago
| Attachment: | serial_pulkomandy_hrev46479-1-g6d9f006-dirty.txt added |
|---|
crash in VBox with two CPUs
follow-up: 12 comment:11 by , 10 years ago
Out of curiosity, does it also crash if you disable USB in Haiku VM?
follow-up: 13 comment:12 by , 10 years ago
does it also crash if you disable USB in Haiku VM?
No. About 20 boots later, it has not crashed once with USB disabled. When re-enabling USB, it started crashing again.
comment:13 by , 10 years ago
Replying to luroh:
does it also crash if you disable USB in Haiku VM?
No. About 20 boots later, it has not crashed once with USB disabled. When re-enabling USB, it started crashing again.
Can you look once crashed a area "OHCI memory mapped registers"? It should contain the fault address.
comment:14 by , 10 years ago
kdebug> area "OHCI memory mapped registers" AREA: 0x820182b0 name: 'OHCI memory mapped registers' owner: 0x1 id: 0x110 base: 0x81000000 size: 0x1000 protection: 0x33 wiring: 0x2 memory_type: 0x10000000 cache: 0x820139d8 cache_type: device cache_offset: 0x0 cache_next: 0x00000000 cache_prev: 0x00000000 page mappings: 0
follow-up: 16 comment:15 by , 10 years ago
Thanks. Looks like the problem isn't in the driver, but somewhere else then. The address 0x81000008 is mapped and shouldn't theoretically generate a page fault.
comment:16 by , 10 years ago
Replying to korli:
Thanks. Looks like the problem isn't in the driver, but somewhere else then. The address 0x81000008 is mapped and shouldn't theoretically generate a page fault.
There's an area at that address, but that doesn't necessarily mean something is actually mapped there. Unfortunately we don't have a KDL command to easily check this. One would have to traverse the paging structures manually. It might also be possible that the mapping simply points to a non-existing physical address (I'm too lazy to look up whether that would cause the same fault type).
At any rate, I think that would be a good first angle of approach: Check what physical address is mapped there (if any) and with what properties and verify that that's the one the driver requested (probably 0xf0902000 judging from the syslog).
comment:17 by , 10 years ago
I got the same problem too when using hrev46476 (self built). When I boot Haiku "normally", the boot process stops before the first icon lights up. When I disable the SMP, I can boot Haiku, but with only one CPU instead of 4. Next, I have disabled the IO APIC, but the boot stops at the 3rd icon. And now I boot Haiku with disable the local APIC, and this is the same as if I disable the SMP. I could save a syslog from the normal boot, and I have attached it to the ticket. Maybe it can help.
by , 10 years ago
| Attachment: | SYSLOG00.TXT added |
|---|
comment:18 by , 10 years ago
hrev46491 adds the KDL command "mapping" to get information about what is really mapped (and how) at a given virtual address.
comment:19 by , 10 years ago
Fantastic, just the KDL feature I was secretly hoping for. :) Unfortunately the commit seems to have broken the gcc2 build, see http://paste.debian.net/69552/ (Sorry about posting that here, I'm not subscribed to the commit list.)
comment:21 by , 10 years ago
Thanks for the fix, Ingo. It however seems to have uncovered another gcc2 build failure, http://paste.debian.net/69563/ I thought I'd mention it here since I believe you fixed something possibly similar reported by Rene, http://www.freelists.org/post/haiku-commits/haiku-hrev46481-srcaddonstranslatorsicns,1
comment:22 by , 10 years ago
comment:23 by , 10 years ago
Thanks again, hrev46495 gcc2 built fine. While I'm waiting for a new native build from PulkoMandy that will hopefully crash in a similar manner, may I solicit some advice on how to use the new KDL feature? For the sake of argument, we could pretend that the serial output will look identical to the one from hrev46479 previously posted in this ticket.
follow-up: 32 comment:24 by , 10 years ago
If the crash happens again in _WriteReg() the output of mapping 0x81000008 (use the actual fault address). Ideally Adrien would also enable TRANSLATION_MAP_TRACING kernel tracing (with stack trace) so that the history of the mapping could be observed (traced 0 -100 -1 #0x81000000 (address rounded down to *000)).
follow-up: 26 comment:25 by , 10 years ago
Attaching new syslog with 'mapping'. However, there seemed to be no 'traced' command available in this build.
comment:26 by , 10 years ago
Replying to luroh:
Attaching new syslog with 'mapping'. However, there seemed to be no 'traced' command available in this build.
The 'traced' command is only available if you've explicitly enabled kernel tracing, as it reserves a fairly large chunk of memory exclusively for that use. Assuming you're building yourself, you want the following entries in build/user_config_headers/tracing_config.h for this case:
#define ENABLE_TRACING 1
#define MAX_TRACE_SIZE (500 * 1024 * 1024)
#define TRANSLATION_MAP_TRACING					1
#define TRANSLATION_MAP_TRACING_STACK_TRACE		10	/* stack trace depth */
comment:27 by , 10 years ago
The mapping looks good. luroh, can you verify that on a successful boot the syslog also says usb ohci -1: iospace offset: 0xf0902000?
comment:29 by , 10 years ago
Yes, on a successful boot (VBox set to one CPU), usb ohci -1: iospace offset: 0xf0902000 is present in the serial output.
Yes, the KDL is continuable. At the kdebug prompt, running co twice lets it boot all the way up.
comment:30 by , 10 years ago
| Component: | - General → System/Kernel |
|---|---|
| Keywords: | vm added |
| Owner: | changed from to |
| Status: | reopened → assigned |
@luroh: I'm a bit surprised that you have to co twice. Could you provide a syslog of the continued KDL?
@pulkomandy: I'm afraid, we do indeed need the kernel tracing to track this further. SCHEDULER_TRACING would be helpful as well, as I think this may be some kind of TLB invalidation issue in a situation where the thread is scheduled to another CPU after mapping the memory. MAX_TRACE_SIZE doesn't need to be that big. I guess 100 MiB should suffice.
comment:31 by , 10 years ago
Attaching continued syslog from Boot --> KDL --> 2 x co --> FirstBootPrompt.
by , 10 years ago
| Attachment: | serial_continued_pulkomandy_hrev46497-dirty.txt added |
|---|
continued syslog
follow-up: 34 comment:32 by , 10 years ago
Replying to bonefish:
If the crash happens again in
_WriteReg()the output ofmapping 0x81000008(use the actual fault address). Ideally Adrien would also enableTRANSLATION_MAP_TRACINGkernel tracing (with stack trace) so that the history of the mapping could be observed (traced 0 -100 -1 #0x81000000(address rounded down to *000)).
Was that intended to read 0 100 -1 by any chance?
comment:33 by , 10 years ago
I managed to get my own prehistoric build machine to spit out a plain gcc2 vmdk which turns out to crash the exact same way, although it seems to require even more cos to fully boot. Rene helped me get the tracing set up. Attaching syslog from Boot to KDL, with mapping and two variants of traced.
follow-up: 36 comment:34 by , 10 years ago
I don't know what to make of the double co output. Normally a KDL for a kernel page fault is not continuable (unless one actually manipulates registers or memory via KDL commands). Continuing just means that the faulting instruction is executed again and, since nothing changed, will also cause the same page fault again. In this case there's no real reason for the page fault to happen in the first place, since the paging structure entries for that address look just fine, so I assumed a stale TLB (translation look-aside buffer, a small per-CPU cache for paging structure entries) entry. According to Intel's architecture manual, when a page fault happens the TLB entries for that address are automatically invalidated. Executing the previously faulting instruction afterward should therefore cause the paging structure entries for the address to be re-read from memory. So in this case a single co should have been sufficient.
That it wasn't, leads to either of the following conclusions:
- The paging structure entries are correct, but, unlike documented, the page fault doesn't invalidate the TLB entry (hardware/virtualization bug or just incorrect documentation). After one or more
cos the thread may be scheduled to another CPU before re-executing the faulting instruction, which would explain why things continue normally afterward. - The paging structure entries for the address in question are incorrect. That means
mappingjust prints wrong values, which seems unlikely. It also wouldn't explain whycoeventually contains.
To verify the theory that this is a TLB invalidation issue, please print a stack trace of a different thread (bt 1 should do). The way the bt command is implemented, it will write the CR3 register which, as a side effect, will invalidate the TLB. A single co should suffice to continue the boot process. If it does, please repeat the test once or twice more to be sure that wasn't just a lucky shot.
Replying to anevilyak:
Replying to bonefish:
(
traced 0 -100 -1 #0x81000000(address rounded down to *000)).Was that intended to read
0 100 -1by any chance?
The first argument is the index of the tracing item from which to start searching for matching items. The index is 1-based and 0 is a special value for the last recorded item. The second argument's absolute value is the maximum number of items to print. Its sign specifies the direction in which the search shall be performed beginning at the start item. Negative means backward. As a convenience, the start item argument 0 also implies backward search, i.e. the actual sign of the second argument is ignored. TL;DR: "-100" and "100" have the same effect in this case.
Analyzing the tracing output:
21173. [    16]     904085: translation map map: 0x82008008: 0x81000000 -> 0xac7e000
21177. [    16]     904194: translation map unmap: 0x82008008: 0x81000000 -> 0xac7e000
23857. [    16]     936797: translation map map: 0x82008008: 0x81000000 -> 0xf0902000
That verifies that the virtual address had indeed been mapped to a different physical address before. Unfortunately the access flags aren't printed -- if my theory holds that would be read-only -- but maybe the information can be inferred from the stack traces. We also see ...
23846. [    16]     935761: schedule 16 "main2", priority 10, CPU 0, previous thread: 16 (ready)
23857. [    16]     936797: translation map map: 0x82008008: 0x81000000 -> 0xf0902000
... that mapping the address in questions happens on CPU 0, while the page fault happens on CPU 1. This does support my theory (or at least it doesn't refute it) that we're dealing with an issue related to propagating TLB entry invalidation to other CPUs. It would be helpful to know whether the previous unmap operation was also performed on CPU 0, but the information isn't available in the syslog.
Beside the simple test mentioned above (bt 1 plus co) the following steps will provide more detailed information:
traced --stacktrace 0 -100 -1 #0x81000000That's the same command as before, just with the "--stacktrace" option. It will print a stack trace for each item.- For each of the last two items printed -- in the last syslog those had the numbers 23857 and 21177, but the numbers will likely differ next time -- please print the preceding tracing items to see which CPU the thread has been scheduled on.
traced <number> -10 -1(replace "<number>" accordingly) will print the previous 10 items. One of them should say "schedule 16 ...". If none does, entertraced(no arguments) to print 10 more items. If that doesn't help, repeat hitting just enter (without any input) to print more items, until the interesting one appears. - After booting, please get an objdump of the kernel (in Terminal:
objdump -D --demangle /system/kernel_x86 > kernel.dump) and attach it to this ticket (zipped). There's the possibility that the compiler on Haiku simply produces incorrect code.
comment:35 by , 10 years ago
The bt 1 trick does not help, it still requires two or three cos after that for booting to continue.
I will revert tomorrow with the requested tracing information.
follow-up: 39 comment:36 by , 10 years ago
Replying to bonefish:
To verify the theory that this is a TLB invalidation issue, please print a stack trace of a different thread (
bt 1should do). The way thebtcommand is implemented, it will write the CR3 register which, as a side effect, will invalidate the TLB. A singlecoshould suffice to continue the boot process. If it does, please repeat the test once or twice more to be sure that wasn't just a lucky shot.
Out of curiosity, does TLB invalidation in this manner apply to all CPUs, or just the current one? In this instance it should be irrelevant since the vbox instance for this crash is, if I remember correctly, restricted to emulating a single core, but in the general case, would be nice to know.
The first argument is the index of the tracing item from which to start searching for matching items. The index is 1-based and 0 is a special value for the last recorded item. The second argument's absolute value is the maximum number of items to print. Its sign specifies the direction in which the search shall be performed beginning at the start item. Negative means backward. As a convenience, the start item argument 0 also implies backward search, i.e. the actual sign of the second argument is ignored. TL;DR: "-100" and "100" have the same effect in this case.
Understood, I was under the mistaken impression that the negative index trick was only usable for the third argument. Thanks for the clarification.
traced --stacktrace 0 -100 -1 #0x81000000That's the same command as before, just with the "--stacktrace" option. It will print a stack trace for each item.
Is a stack trace depth of 10 likely to be sufficient? That's what we currently have the mapping trace depth configured for on his VM.
by , 10 years ago
| Attachment: | kernel.dump.x86_gcc2-haiku.bz2 added |
|---|
Haiku kernel as produced by x86_gcc2 for/on hrev46500.
by , 10 years ago
| Attachment: | kernel.dump.x86_gcc2-freebsd.bz2 added |
|---|
Haiku x86_gcc2 kernel produced by x86_gcc2 FreeBSD cross compiler (also hrev46500).
comment:37 by , 10 years ago
Attaching syslog with traced --stacktrace 0 -100 -1 #0x81000000. The last item in the list, number 23994, mentions "schedule 16 ...".
An objdump coming up shortly.
by , 10 years ago
| Attachment: | serial_luroh_hrev46499_stacktrace.txt added |
|---|
syslog with 'traced --stacktrace'
by , 10 years ago
| Attachment: | kernel.dump_luroh_hrev46499.zip added |
|---|
comment:38 by , 10 years ago
In case it may be of interest, the same vmdk doesn't behave well in VMware Player either with two CPUs. No kernel panics so far, but it always freezes at some bootsplash icon, sometimes leaving entries in syslog similar to when running in VBox:
vm_page_fault: vm_soft_fault returned error 'Bad address' on fault at 0xccfe46f8, ip 0x80052a4c, write 1, user 0, thread 0x10
The vmdk in question (with tracing enabled) is available for download here (78 MB): http://www.filedropper.com/haikuhrev46499vmdk
follow-up: 40 comment:39 by , 10 years ago
Replying to anevilyak:
Replying to bonefish: Out of curiosity, does TLB invalidation in this manner apply to all CPUs, or just the current one?
Just the current one. I overlooked that it actually only invalidates non-global TLB entries (we use global ones for the kernel), so this doesn't have the desired effect in this case anyway.
In this instance it should be irrelevant since the vbox instance for this crash is, if I remember correctly, restricted to emulating a single core, but in the general case, would be nice to know.
I was (and still am) under the impression that this issue only occurs with multiple CPUs and also goes away when SMP is disabled. Please correct me, if I'm wrong.
Is a stack trace depth of 10 likely to be sufficient? That's what we currently have the mapping trace depth configured for on his VM.
Yep, that's fine.
Unfortunately the latest syslog hasn't been too helpful. We can see that the address in question was mapped and unmapped twice before as part of a regular area. Before that, it was unmapped by vm_free_unused_boot_loader_range(), so apparently it had been used in the boot loader. The last unmap happened on the same CPU that crashed, but since TLB invalidation is normally only performed when the entry had actually been used (which can't be inferred from the available data), this doesn't mean much.
In hrev46506 I've added more extensive information to the translation map kernel tracing. I'm attaching a patch that adds tracing entries when TLB entries are actually being invalided. It also adds a KDL command tlb which invalidates the whole TLB of the current CPU. It is meant to replace the ill-conceived bt 1 idea. So tlb plus co should continue the boot process, if the original theory holds.
Other than that basically the same information as before are needed:
traced --stacktrace 0 -100 -1 #0x81000000traced <number> -10 -1for all six of the printed "translation map" entries. There may be additional "TLB invalidate" entries. Those can be skipped, since they already print the current CPU.- Additionally:
traced --stacktrace 0 -500 -1 "#invalidate all"
by , 10 years ago
| Attachment: | tlb-debugging.diff added |
|---|
Patch adding additional TLB invalidation tracing
comment:40 by , 10 years ago
Replying to bonefish:
I was (and still am) under the impression that this issue only occurs with multiple CPUs and also goes away when SMP is disabled. Please correct me, if I'm wrong.
Oops, my mistake, that was from one specific test (verifying the syslog entry for the ohci controller on successful boot) earlier. Sorry for the noise, and thanks for the other clarifications.
comment:41 by , 10 years ago
The tlb command doesn't seem to make any difference. In the attached syslog, you can see me running a few tlbs and a total of 20 cos before the system continued booting.
I'll revert with a syslog containing the tracing information shortly.
by , 10 years ago
| Attachment: | serial_luroh_hrev46507-dirty_tlb.txt added |
|---|
syslog with 'tlb's and 'co's
by , 10 years ago
| Attachment: | serial_luroh_hrev46507-dirty.txt added |
|---|
syslog with 'traced' as per comment 39
follow-up: 43 comment:42 by , 10 years ago
Not sure if related. When testing booting with two CPUs but SMP disabled, I encountered a panic after reaching the desktop, after a few fully successful boots.
PANIC: supposed to be free page 0x82cec8e4 has cache
Attaching syslog. I'm keeping the KDL alive in case more information is needed.
by , 10 years ago
| Attachment: | serial_luroh_hrev46507-dirty_desktop_panic.txt added |
|---|
PANIC: supposed to be free page 0x82cec8e4 has cache
comment:43 by , 10 years ago
Replying to luroh:
Attaching syslog. I'm keeping the KDL alive in case more information is needed.
You could do a page 0x82cec8e4 and then a cache _cache. If that prints an area, area ... with the area ID as argument, or if it prints a vnode, vnode -p ... with the vnode pointer as argument.
I'm afraid unless you have PAGE_ALLOCATION_TRACING, PAGE_STATE_TRACING, and/or VM_CACHE_TRACING (level 2) enabled, there's no way to track this further, though.
comment:44 by , 10 years ago
It didn't yield much:
page 0x82cec8e4
PAGE: 0x82cec8e4
queue_next,prev: 0x82cec918, 0x00000000
physical_number: 0x12e9a027000884dd

[*** READ FAULT at 0x12005452, pc: 0x80116b16 ***]
kdebug> cache _cache
kdebug>
I'll create a new ticket if I encounter it again.
comment:45 by , 10 years ago
Looks like the page structures have been corrupted. So there's even less information to be gathered.
follow-up: 47 comment:46 by , 10 years ago
Mmh, I'm a bit clueless ATM. The TLB invalidation issue theory is off the table I guess. The test with the tlb command failed and at least according to the output the invalidation is done correctly. Since the paging structure entries look good, something must be set up incorrectly on that CPU (like CR4, but that seems very unlikely). That would at least explain, why the KDL can be continued eventually -- when the thread is scheduled to CPU 0, which apparently is set up correctly -- but it leaves me wondering why everything still works so well.
follow-up: 49 comment:47 by , 10 years ago
I take it the disassembly of the faulting function didn't look suspicious either?
comment:48 by , 10 years ago
I will start bisecting using Adrien's regression range to see if I can find any offending commit. It may take a week since I'll be away from my build machine for a few days.
For anyone interested, I have uploaded raw and vmdk images with tracing and tlb here (79 MB each):
http://www.filedropper.com/haikuhrev46507-dirtyraw
http://www.filedropper.com/haikuhrev46507-dirtyvmdk
comment:49 by , 10 years ago
Replying to anevilyak:
I take it the disassembly of the faulting function didn't look suspicious either?
That function would be in the ohci module, but it seems to do what it is supposed to, anyway -- it maps the hardware register and later writes to one. Your kernel objdumps aren't easily comparable. With diff one gets lots of acceptable differences (different order of functions, different registers allocated, different orders of instructions where not dependent). I had a look at some code that invalidates TLB entries and that looked OK.
by , 10 years ago
| Attachment: | BISECT_LOG added |
|---|
comment:51 by , 10 years ago
From a quick look at that commit, nothing really jumps out at me as obviously wrong in the normal case, as most of it is specific to a KDL command that wouldn't get executed during normal boot ; the only change it makes which I'm not entirely certain about is the one to fifo's WriteRequest class, namely whether one needs to hold some particular lock when calling thread_get_current_thread(), and if so, whether that one's already held at that point, i.e. from whichever code winds up ultimately calling Inode::WriteDataToBuffer().
comment:52 by , 10 years ago
I don't think the commit in question is directly related. The only code that will have been executed at the time of the crash is fifo_init(), which registers the debugger command. It's more likely that the additional heap usage or kernel size triggers a preexisting bug in the kernel or in gcc.
follow-up: 54 comment:53 by , 10 years ago
Just to follow up on this a bit. Out of curiosity, I just tested a natively built gcc2 vmdk from Pawel's branch (version f36e141) and it too crashes in the same manner, even on a now slightly newer version of VirtualBox than I previously used. A few (2-10, sometimes 20) cos lets it boot all the way to desktop. Attaching syslog, FWIW.
by , 10 years ago
| Attachment: | serial_affine_f36e141.txt added |
|---|
comment:54 by , 10 years ago
Replying to luroh:
Just to follow up on this a bit. Out of curiosity, I just tested a natively built gcc2 vmdk from Pawel's branch (version f36e141) and it too crashes in the same manner, even on a now slightly newer version of VirtualBox than I previously used. A few (2-10, sometimes 20)
cos lets it boot all the way to desktop. Attaching syslog, FWIW.
It looks like you have built from my repository but from master branch which is just an outdated version of the upstream master. My contract work takes place in branch "scheduler".
comment:56 by , 10 years ago
After compiling and testing several revision of haiku, I came to the hrev46440 which is the first one that has this bug. This revision is related to the KDL fifo command integration.
Hope this helps.
comment:57 by , 10 years ago
Thanks, but as written in comment:52 already, I think it can only be related indirectly.
comment:58 by , 10 years ago
| Cc: | added |
|---|
comment:59 by , 10 years ago
comment:60 by , 10 years ago
| Resolution: | → fixed |
|---|---|
| Status: | assigned → closed |
Confirmed fixed on real hardware here.
Nevermind, a nightly of hrev46447 is working fine. Must be a problem on my side.