

Opened 4 years ago
Last modified 6 months ago
#15585 new bug
IO stall for a long time during creation or deletion of many small files
| Reported by: | X512 | Owned by: | nobody |
|---|---|---|---|
| Priority: | normal | Milestone: | Unscheduled |
| Component: | System/Kernel | Version: | R1/Development |
| Keywords: | Cc: | ||
| Blocked By: | Blocking: | ||
| Platform: | All |
Description
This is hrev53644 x86_64.
When creating or deleting a lot of small files (extracting source code archive for example) IO stalls for several seconds. IO operations blocks even on different physical disk.
I created test that create a lot of small files and measure duration of creation of each file. Test work on Haiku and Windows. Test performed on same USB3 drive, that was formatted before test. For Windows NTFS is used.
Attachments (15)
.png)
.png)
.png)
.png)
.png)
.png)
.png)
.png)
.png)
.png)
Change History (56)
by , 4 years ago
| Attachment: | FileTest.cpp added |
|---|
by , 4 years ago
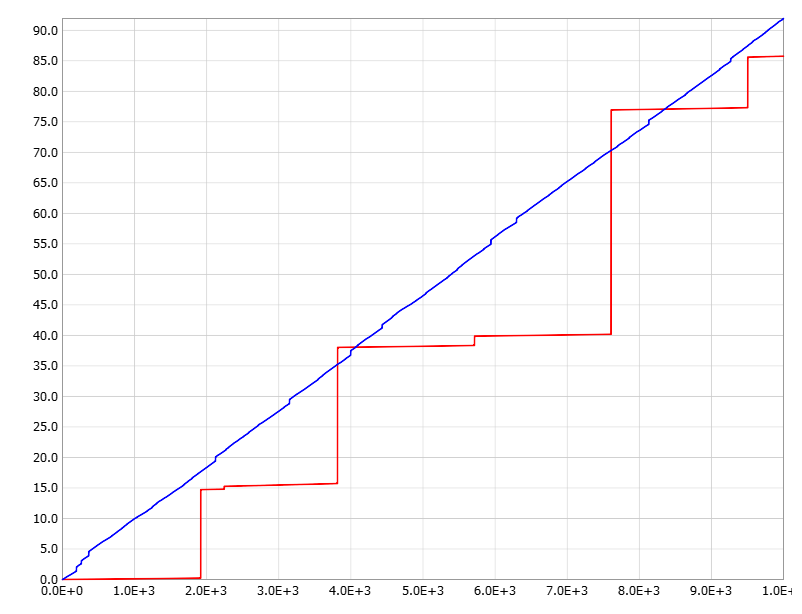
Plot of results. X is number of created files, Y is time in seconds. Red: Haiku, blue: Windows.
by , 4 years ago
| Attachment: | Plot (Haiku).png added |
|---|
Scatter plot for Haiku. X: created file number, Y: duration in seconds. Longest duration is about 22 seconds.
by , 4 years ago
| Attachment: | Plot (Windows).png added |
|---|
Scatter plot for Windows. X: created file number, Y: duration in seconds. Longest duration is about 0.7 seconds.
comment:2 by , 4 years ago
USB likely compounds this problem. Please retest on a SATA or NVMe drive and see if the problem persists.
by , 4 years ago
| Attachment: | Plot (Haiku, SATA HDD).png added |
|---|
Scatter plot for Haiku SATA HDD. X: created file number, Y: duration in seconds. Longest duration is about 6.5 seconds.
comment:3 by , 4 years ago
Retested on SATA HDD. Longest duration is about 6.5 seconds, better than USB, but still bad.
comment:4 by , 4 years ago
I can't seem to easily reproduce this, but I also did not replicate your exact setup...
Can you please replicate this, and then drop into KDL, find a thread that is waiting on I/O (besides your test program, of course), and then print the object it's waiting on? (The "threads" list will display what and its address/ID, and then you can use the relevant command e.g. sem, mutex, etc.)
comment:5 by , 4 years ago
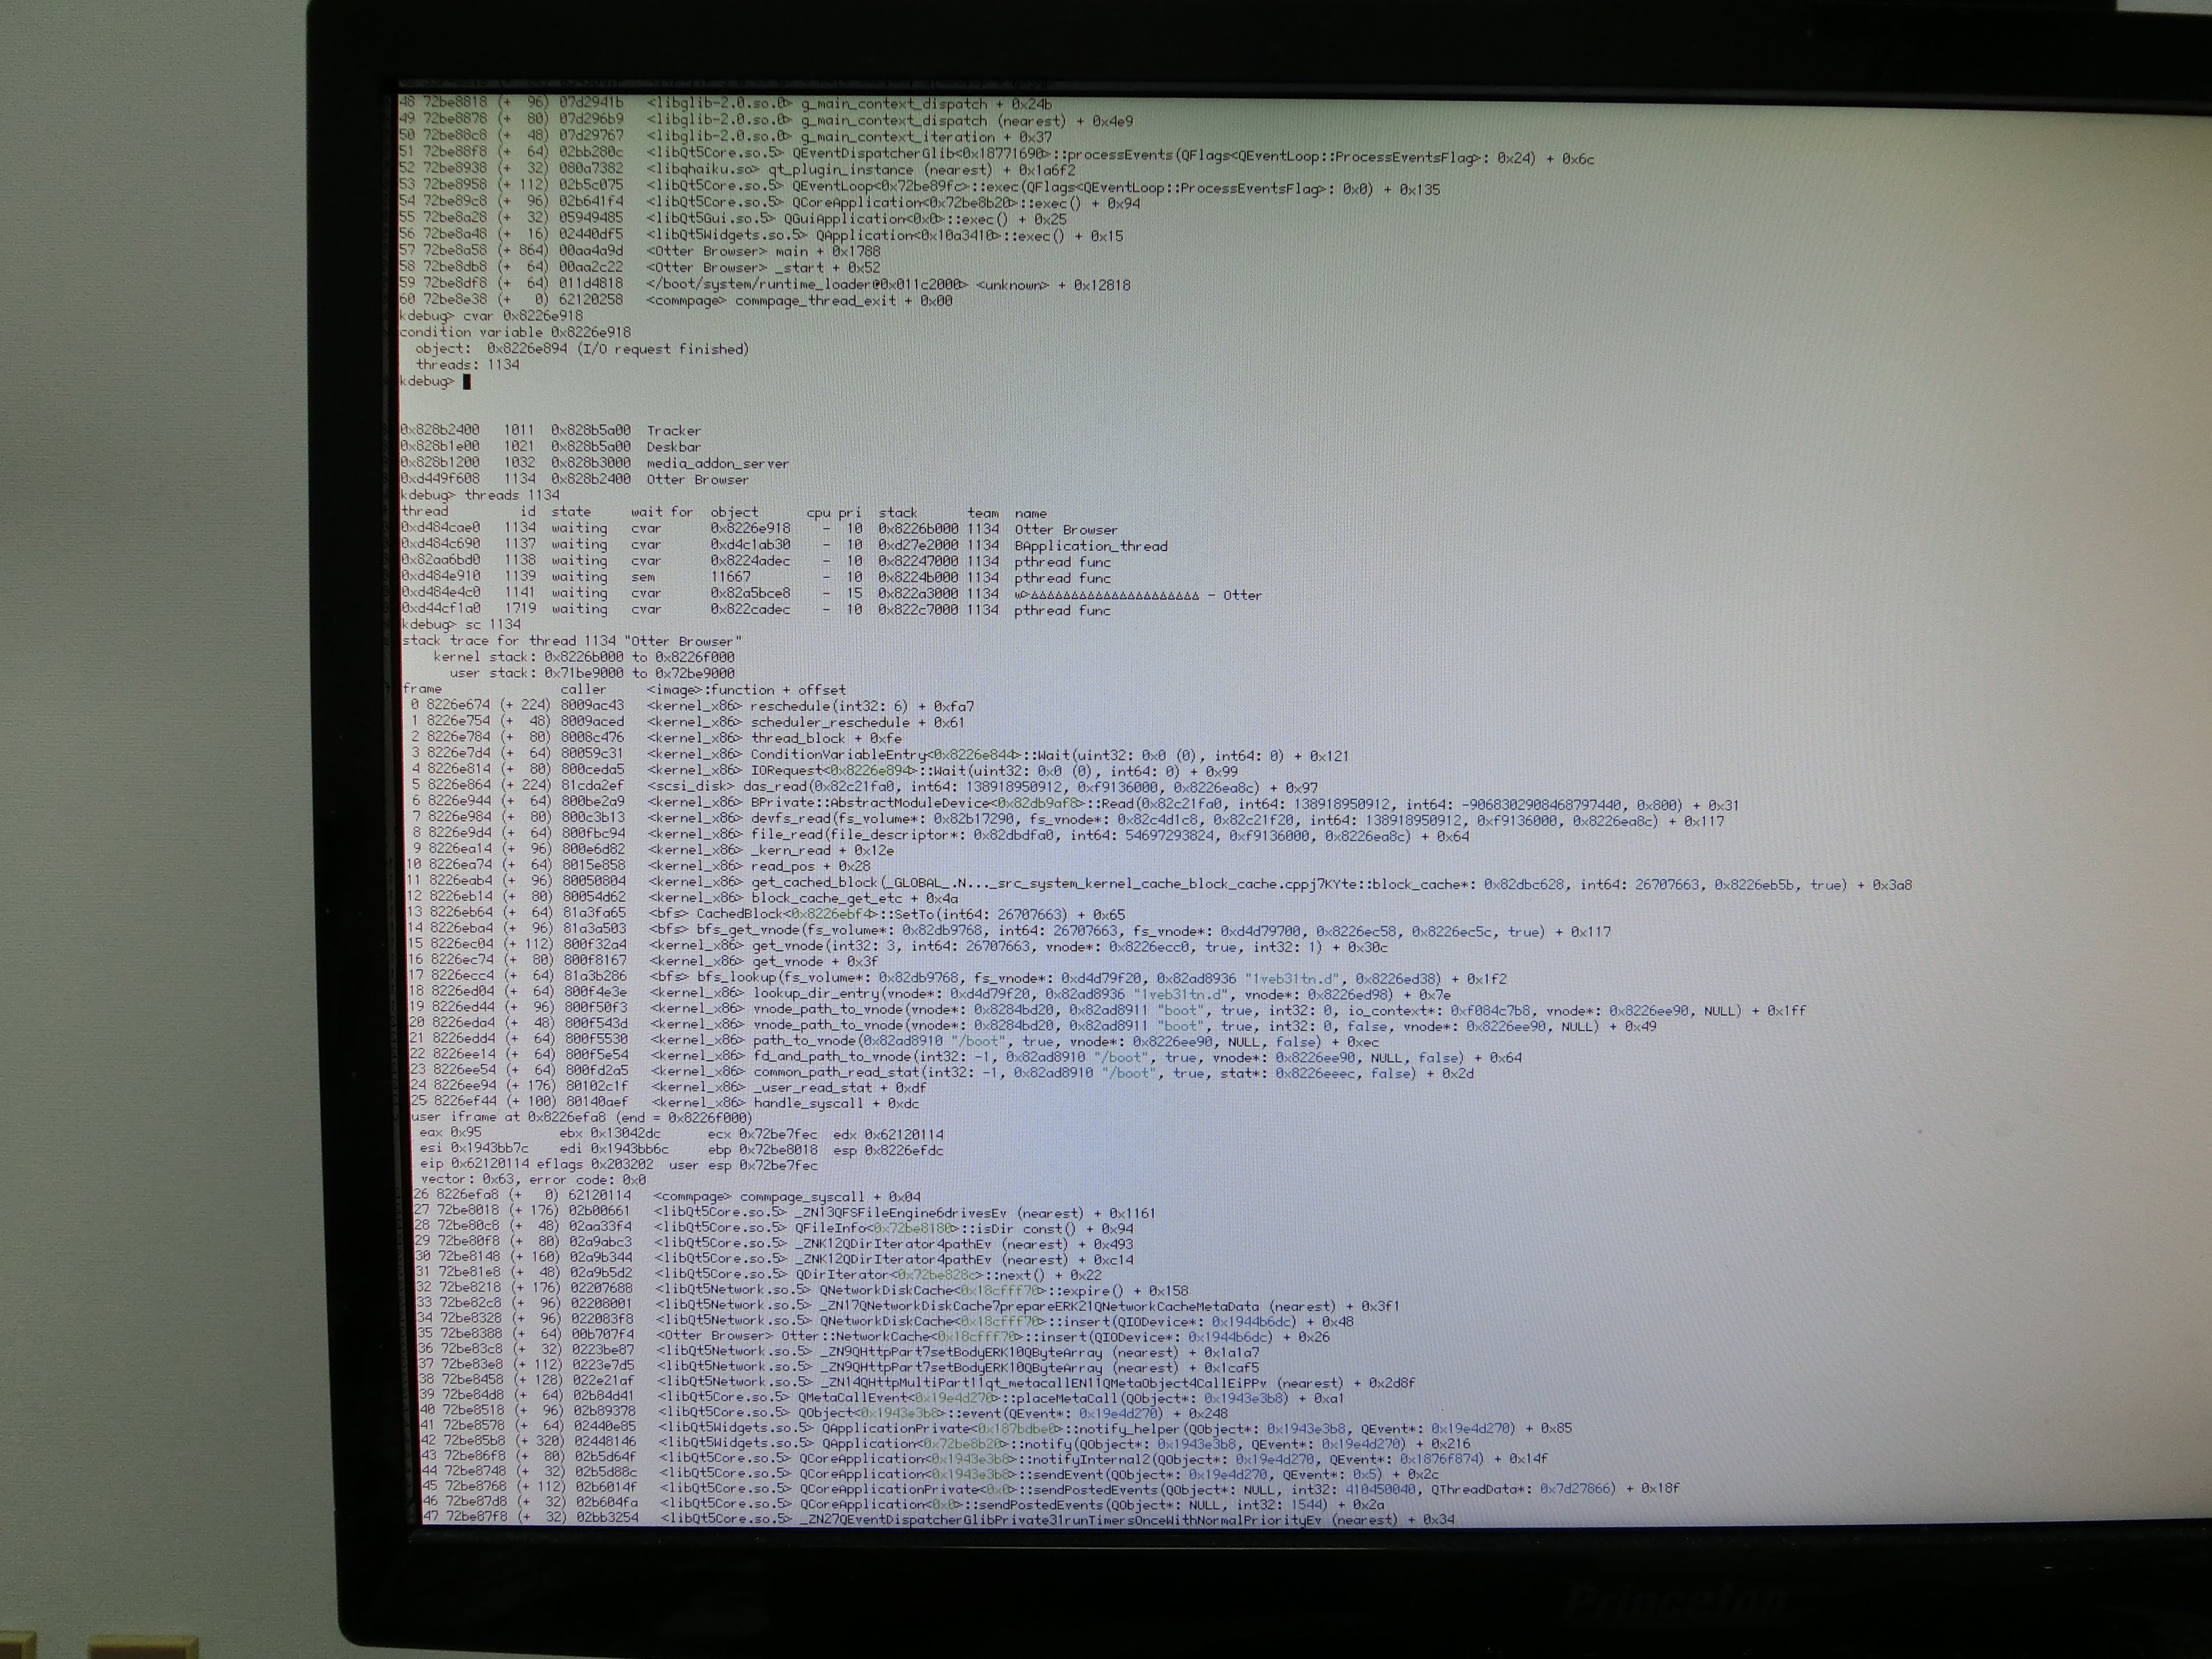
I catched IO freeze for several seconds in OtterBrowser during many files deletion. Deletion was on SATA HDD. I attach backtrace of frozen thread.
by , 4 years ago
| Attachment: | CIMG4590_1.jpg added |
|---|
KDL after resume. Probably result of some timeout.
comment:6 by , 4 years ago
The backtrace just indicates it's waiting on SCSI I/O. That doesn't really explain why there would be a "stall"...
follow-ups: 8 9 comment:7 by , 4 years ago
Actually these graphs look a lot like block_cache saturation, which is a problem that https://git.haiku-os.org/haiku/commit/?id=6d336fda4aca32649de3e1d91403da4452f4bef8 was supposed to help with (see commit message.) Are things considerably worse before that commit? Or does it not appear to affect anything.
comment:8 by , 4 years ago
Replying to waddlesplash:
Actually these graphs look a lot like block_cache saturation, which is a problem that https://git.haiku-os.org/haiku/commit/?id=6d336fda4aca32649de3e1d91403da4452f4bef8 was supposed to help with (see commit message.) Are things considerably worse before that commit? Or does it not appear to affect anything.
Yes, this commit improved IO a lot, but problem still present.
comment:9 by , 4 years ago
Replying to waddlesplash:
Actually these graphs look a lot like block_cache saturation
I think it can be fixed by limiting write cache size.
follow-ups: 11 12 comment:10 by , 4 years ago
I don't think that's a good idea; as the graph shows, we are "on average" slightly better than Windows performance. So the problem is our write-back behavior, which should write back in a different pattern so the cache does not fill up, probably.
comment:11 by , 4 years ago
Replying to waddlesplash:
I don't think that's a good idea; as the graph shows, we are "on average" slightly better than Windows performance.
Haiku may finished faster because cache was not written to disk at moment of test complete.
comment:12 by , 4 years ago
Replying to waddlesplash:
So the problem is our write-back behavior, which should write back in a different pattern so the cache does not fill up, probably.
Cache will fill up in any case if disk is slower than sending write requests.
comment:14 by , 4 years ago
Haiku may finished faster because cache was not written to disk at moment of test complete.
OK, but the same may be true on Windows, right? And the intermediate "jumps" go over the Windows numbers, so that's a good indication that when the cache does write back, it's about as fast as Windows.
Try on a RAMdisk and see what performance you get then; that should help isolate if the I/O stalls are due to the SATA/SCSI stack, or due to BFS and caching logic itself.
Cache will fill up in any case if disk is slower than sending write requests.
Yes, and then I'd expect to see the graph "level off" and move at a slower but constant rate. The fact that it doesn't indicates the write-back code has bad logic here somehow.
Does somebody know how other OS (Linux, BSD) deal with this problem?
I don't think this is a difficult theoretical problem or anything, there's just some bug in how we handle deciding what and when to write-back.
comment:15 by , 4 years ago
Issue is not present on ram-disk. Longest IO duration time is 0.1 seconds.
comment:16 by , 4 years ago
I get PANIC: cache destroy: still has partial slabs KDL on unmount ram-disk after some experiments (creating/copying/deleting about 100000 small files).
comment:17 by , 4 years ago
Oops, accidentally sent my last comment before finishing it. This report sounds similar to some behavior I was noticing last year that lead me down the path of digging in to I/O on haiku to understand how it works. I sent an email about it to the list here.
I was curious to see if I would get the same kind of results that you do X512 so I tried running it on one of my systems and the results are pretty comperable. With a SATA spinning disk I'm seeing 5+ second pauses.
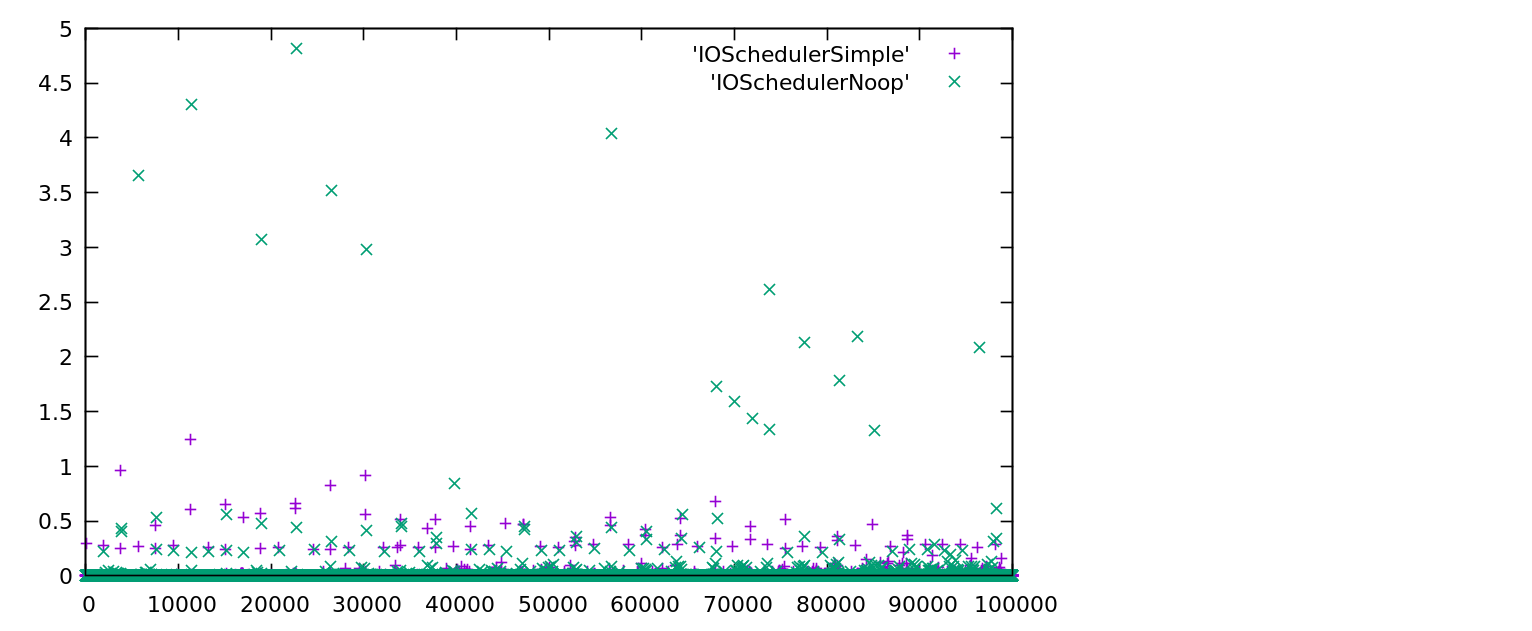
I only had limited time for this today so I don't have anything else interesting to offer. Out of curiosity I tried running your benchmark with the IOSchedulerNoop experiment I had started. I attached the results as plot-IOSchedulerNoop-comparison.
The latency is definitely a lot flatter with IOSchedulerNoop, but that doesn't necessarily mean that this is the main problem. That implementation is also not finished. I just thought that would be an interesting data point.
by , 4 years ago
| Attachment: | plot-IOSchedulerNoop-comparison.png added |
|---|
Plot comparing IOSchedulerSimple wth IOSchedulerNoop from my iostats branch at github.com/ambroff/haiku
comment:18 by , 4 years ago
Can someone explain where write cache are flushed? I don't see flushing logic here: https://xref.landonf.org/source/xref/haiku/src/system/kernel/cache/file_cache.cpp. If I correctly understand write logic, write path is
- <FS driver write>
- file_cache_write
- cache_io
- ???
- vfs_write_pages
- <Disk driver write>
- IOSchedulerSimple::ScheduleRequest
- IORequest::Wait()
- IOSchedulerSimple::OperationCompleted
comment:19 by , 4 years ago
IIRC, PageWriteWrapper takes care of writing back dirty pages from VMCaches.
comment:20 by , 4 years ago
page_writer has suspicious delays and snooze calls that may be related.
comment:21 by , 4 years ago
PANIC: cache destroy: still has partial slabs
This is #10061.
Issue is not present on ram-disk. Longest IO duration time is 0.1 seconds.
This makes sense, then, because the page_writer is obviously not used on a RAMDisk, as the pages are only in memory.
comment:22 by , 4 years ago
The logic that assigns "pagesSinceLastSuccessfulWrite" is very strange and I'm not sure I fully understand the decisions here. This does look very suspicious, though.
comment:23 by , 4 years ago
X512: One thing you may find useful in investigating this is the "scheduling recorder". You have to build it manually ("jam scheduling_recorder"), and then run it (by itself and Ctrl+C to stop), or with some other app. It records all threads and everything they wait on, so then you can run the DebugAnalyzer (also needs to be built manually) on the output of scheduling_recorder, you can look at what threads were waiting on and for how long, both in overview and individually.
comment:25 by , 4 years ago
I think I managed to catch it during one of these "pauses", and this is the stack trace:
kdebug> bt 547
stack trace for thread 547 "tar"
    kernel stack: 0xffffffff81169000 to 0xffffffff8116e000
      user stack: 0x00007f4aa268f000 to 0x00007f4aa368f000
frame                       caller             <image>:function + offset
 0 ffffffff8116d7b0 (+ 112) ffffffff80098102   <kernel_x86_64> reschedule(int) + 0x4f2
 1 ffffffff8116d820 (+  64) ffffffff80088086   <kernel_x86_64> thread_block + 0xf6
 2 ffffffff8116d860 (+  80) ffffffff80054e15   <kernel_x86_64> ConditionVariableEntry::Wait(unsigned int, long) + 0xf5
 3 ffffffff8116d8b0 (+  96) ffffffff8151857c   <nvme_disk> await_status(nvme_disk_driver_info*, nvme_qpair*, int&) + 0x4c
 4 ffffffff8116d910 (+  80) ffffffff8151870b   <nvme_disk> nvme_disk_ioctl(void*, unsigned int, void*, unsigned long) + 0x13b
 5 ffffffff8116d960 (+ 320) ffffffff800ce726   <kernel_x86_64> devfs_ioctl(fs_volume*, fs_vnode*, void*, unsigned int, void*, unsigned long) + 0x206
 6 ffffffff8116daa0 (+  64) ffffffff800f044c   <kernel_x86_64> fd_ioctl(bool, int, unsigned int, void*, unsigned long) + 0x5c
 7 ffffffff8116dae0 (+  32) ffffffff800f1b09   <kernel_x86_64> _kern_ioctl + 0x39
 8 ffffffff8116db00 (+ 112) ffffffff8016b90d   <kernel_x86_64> ioctl + 0x2d
 9 ffffffff8116db70 (+ 384) ffffffff818a6d14   <bfs> _ZN7Journal22_WriteTransactionToLogEv.localalias.9 + 0x7e4
10 ffffffff8116dcf0 (+  48) ffffffff818a6fe5   <bfs> Journal::Unlock(Transaction*, bool) + 0x35
11 ffffffff8116dd20 (+ 128) ffffffff818ac211   <bfs> bfs_create_dir(fs_volume*, fs_vnode*, char const*, int) + 0x131
12 ffffffff8116dda0 (+ 304) ffffffff80104b92   <kernel_x86_64> dir_create(int, char*, int, bool) + 0x62
13 ffffffff8116ded0 (+  80) ffffffff8010d484   <kernel_x86_64> _user_create_dir + 0x84
14 ffffffff8116df20 (+  16) ffffffff8014fd34   <kernel_x86_64> x86_64_syscall_entry + 0xfe
user iframe at 0xffffffff8116df30 (end = 0xffffffff8116dff8)
 rax 0x74                  rbx 0x7f4aa368f648        rcx 0x14ed6357b64
 rdx 0x1c0                 rsi 0x240c34cee0          rdi 0xffffffff
 rbp 0x7f4aa368e830         r8 0x7f4aa368e8c0         r9 0x1
 r10 0x240c34cee0          r11 0x3206                r12 0x3
 r13 0x7f4aa368f668        r14 0x0                   r15 0x0
 rip 0x14ed6357b64         rsp 0x7f4aa368e818     rflags 0x3206
 vector: 0x63, error code: 0x0
15 ffffffff8116df30 (+139960675076352) 0000014ed6357b64   <libroot.so> _kern_create_dir + 0x0c
16 00007f4aa368e830 (+ 192) 000001d055fb07fa   <tar> remove_delayed_set_stat (nearest) + 0xbdb
17 00007f4aa368e8f0 (+  48) 000001d055fb1ed1   <tar> extract_archive + 0x293
18 00007f4aa368e920 (+ 192) 000001d055fbabf0   <tar> read_and + 0x24c
19 00007f4aa368e9e0 (+  32) 000001d055fcd84c   <tar> main + 0x199
20 00007f4aa368ea00 (+  48) 000001d055fa20d1   <tar> _start + 0x51
21 00007f4aa368ea30 (+  48) 0000009d0e3dd485   </boot/system/runtime_loader@0x0000009d0e3c9000> <unknown> + 0x14485
22 00007f4aa368ea60 (+   0) 00007fff8f567260   <commpage> commpage_thread_exit + 0x00
kdebug>
So it seems that it's waiting for the drive cache to flush. ram_disk has nothing to do here, so it makes sense that the "stall" is not seen on the ramdisk; it also explains why we are, despite the pauses, not slower than Windows: after flushing the drive cache it will be empty, so we can then saturate it again before things get slow.
comment:26 by , 4 years ago
<bfs> _ZN7Journal22_WriteTransactionToLogEv.localalias.9 + 0x7e4 <bfs> Journal::Unlock(Transaction*, bool) + 0x35
Is it related to journal?
comment:27 by , 4 years ago
Uh, yes, it's this line: https://xref.landonf.org/source/xref/haiku/src/add-ons/kernel/file_systems/bfs/Journal.cpp#891
comment:28 by , 4 years ago
I commented ioctl(fVolume->Device(), B_FLUSH_DRIVE_CACHE); and issue is still present. Longest delay for 50000 files in USB3 disk is 19.4 seconds.
comment:29 by , 4 years ago
Well, then the stall you are seeing must be something else; seems like dropping to KDL repeatedly might catch it?
by , 4 years ago
| Attachment: | FileTestWatchdog.cpp added |
|---|
comment:31 by , 4 years ago
I added watchdog timer to FileTest that enter KDL if file creation takes too much time. Note that after exiting KDL file system is almost definitely get corrupted, so volume should be reformatted after each test.
comment:32 by , 4 years ago
In most cases I get following stack trace:
KERN: USER: FileTest: timeout, thread: 1337
KERN: Welcome to Kernel Debugging Land...
KERN: Thread 1340 "watchdog" running on CPU 0
KERN: kdebug> bt 1337stack trace for thread 1337 "FileTestWatchdog"
KERN:     kernel stack: 0xffffffff82055000 to 0xffffffff8205a000
KERN:       user stack: 0x00007fb94f885000 to 0x00007fb950885000
KERN: frame                       caller             <image>:function + offset
KERN:  0 ffffffff82059630 (+ 112) ffffffff80098102   <kernel_x86_64> reschedule(int) + 0x4f2
KERN:  1 ffffffff820596a0 (+  64) ffffffff80088086   <kernel_x86_64> thread_block + 0xf6
KERN:  2 ffffffff820596e0 (+  80) ffffffff80054e15   <kernel_x86_64> ConditionVariableEntry::Wait(unsigned int, long) + 0xf5
KERN:  3 ffffffff82059730 (+ 128) ffffffff800da595   <kernel_x86_64> IORequest::Wait(unsigned int, long) + 0x95
KERN:  4 ffffffff820597b0 (+ 368) ffffffff824ca9cc   <scsi_disk> das_write(void*, long, void const*, unsigned long*) + 0x9c
KERN:  5 ffffffff82059920 (+ 112) ffffffff800f19e8   <kernel_x86_64> _kern_writev + 0x118
KERN:  6 ffffffff82059990 (+  32) ffffffff8016b573   <kernel_x86_64> writev_pos + 0x13
KERN:  7 ffffffff820599b0 (+ 384) ffffffff82141e04   <bfs> _ZN7Journal22_WriteTransactionToLogEv.localalias.9 + 0x8f4
KERN:  8 ffffffff82059b30 (+  48) ffffffff82141fc5   <bfs> Journal::Unlock(Transaction*, bool) + 0x35
KERN:  9 ffffffff82059b60 (+ 144) ffffffff821469e6   <bfs> bfs_create(fs_volume*, fs_vnode*, char const*, int, int, void**, long*) + 0x216
KERN: 10 ffffffff82059bf0 (+ 400) ffffffff801030e0   <kernel_x86_64> create_vnode(vnode*, char const*, int, int, bool) + 0xa0
KERN: 11 ffffffff82059d80 (+ 320) ffffffff80104b04   <kernel_x86_64> file_create(int, char*, int, int, bool) + 0x54
KERN: 12 ffffffff82059ec0 (+  96) ffffffff8010ce14   <kernel_x86_64> _user_open + 0xd4
KERN: 13 ffffffff82059f20 (+  16) ffffffff8014fd34   <kernel_x86_64> x86_64_syscall_entry + 0xfe
KERN: user iframe at 0xffffffff82059f30 (end = 0xffffffff82059ff8)
KERN:  rax 0x6b                  rbx 0x1aabea5cd10         rcx 0x14b12395a64
KERN:  rdx 0x601                 rsi 0x7fb950884550        rdi 0xffffffff
KERN:  rbp 0x7fb950822a40         r8 0x3a38e7b588           r9 0x1
KERN:  r10 0x1a4                 r11 0x3202                r12 0x4
KERN:  r13 0x3a38e7b584          r14 0x1                   r15 0x7fb9508849e0
KERN:  rip 0x14b12395a64         rsp 0x7fb9508229d8     rflags 0x3202
KERN:  vector: 0x63, error code: 0x0
KERN: 14 ffffffff82059f30 (+140436009945872) 0000014b12395a64   <libroot.so> _kern_open + 0x0c
KERN: 15 00007fb950822a40 (+  48) 0000014b123c7730   <libroot.so> _IO_new_file_fopen + 0xa0
KERN: 16 00007fb950822a70 (+  48) 0000014b123ca205   <libroot.so> __fopen_internal + 0x75
KERN: 17 00007fb950822aa0 (+400384) 0000003a38e7b38a   <FileTestWatchdog> TestApplication::ArgvReceived(int, char**) + 0xca
KERN: 18 00007fb9508846a0 (+  96) 00000211af0fe05c   <libbe.so> BApplication::_ArgvReceived(BMessage*) + 0x18c
KERN: 19 00007fb950884700 (+ 592) 00000211af100585   <libbe.so> BApplication::DispatchMessage(BMessage*, BHandler*) + 0x1c5
KERN: 20 00007fb950884950 (+  80) 00000211af10780c   <libbe.so> BLooper::task_looper() + 0x26c
KERN: 21 00007fb9508849a0 (+  32) 00000211af0fd761   <libbe.so> BApplication::Run() + 0x21
KERN: 22 00007fb9508849c0 (+ 432) 0000003a38e7ad6c   <FileTestWatchdog> main + 0x37
KERN: 23 00007fb950884b70 (+  48) 0000003a38e7ad2e   <FileTestWatchdog> _start + 0x3e
KERN: 24 00007fb950884ba0 (+  48) 0000022787d9e485   </boot/system/runtime_loader@0x0000022787d8a000> <unknown> + 0x14485
KERN: 25 00007fb950884bd0 (+   0) 00007ffedc5a5260   <commpage> commpage_thread_exit + 0x00
KERN: kdebug> es
Sometimes watchdog triggers in Journal::TransactionDone.
comment:33 by , 4 years ago
Try adding a dprintf() before the writev_pos. My guess is that the journal is doing a lot of very small writes, instead of one large one, or something like that.
comment:34 by , 4 years ago
Someone reported on IRC that disabling VirtualMemory made a difference here. Seems especially weird, I don't know how that would be possible; but may be worth testing at least?
comment:35 by , 4 years ago
I always disable virtual memory (PC have 8GB of RAM and it should be enougth) and issue is still present. Or you mean recompling kernel without virtual memory support?
comment:36 by , 3 years ago
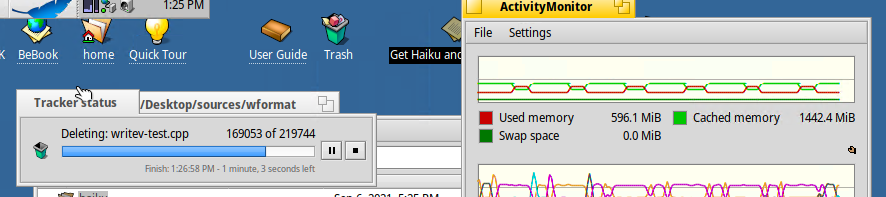
Waddlesplash told me to add this picture I noticed while deleting a local copy of Haiku sources. Note the memory behavior. I had never noticed this before. It was slower than usual deleting files. Before, I was building Haiku and terminated it via ctrl+c after about 30 minutes.
No syslog as I had already rebooted before mentioning it on IRC.
hrev55181+57 (Beta 3).
by , 3 years ago
| Attachment: | Memory.PNG added |
|---|
comment:38 by , 2 years ago
So do I. Used memory jumps by very close to a round 2GB and cached memory decreases by the same amount. That seems highly uncoincidental.
comment:39 by , 2 years ago
Note that after exiting KDL file system is almost definitely get corrupted, so volume should be reformatted after each test.
This seems like a separate but very related bug. I wonder if it is somehow due to the block cache thinking that blocks have been written back and thus marking them "clean" when in reality they aren't.
comment:40 by , 2 years ago
I poked around with profiles more, using QCachegrind to dive through them instead of the more basic "profile" output. Unfortunately I didn't really notice anything more in particular that could be leading to this. Probably the trick is going to be figuring out what causes memory usage to spike and then drop, which at least does not seem to be discernable from the profiling results.
The scheduling_recorder may help, though. Did anyone try that yet?
Test program. Usage: FileTest <directory where create files> > <log file>