

#9560 closed bug (fixed)
[hda] switching Input frequency crashes the kernel
| Reported by: | diver | Owned by: | korli |
|---|---|---|---|
| Priority: | normal | Milestone: | R1/beta2 |
| Component: | Drivers/Audio/HDA | Version: | R1/Development |
| Keywords: | vm | Cc: | jua, ttcoder |
| Blocked By: | Blocking: | ||
| Platform: | All |
Description
This is hrev45396.
Swtitching Input frequency menu in Media -> HD Audio a couple of time reliably crashes Haiku with random back traces. I even managed to crash app_server/Media/consoled/debug_server this way a couple of times.
KERN: vm_page_fault: thread "_m_task_" (614) in team "Media" (557) tried to read address 0x38500, ip 0x608acc ("libroot.so_seg0ro" +0x3aacc)
KERN: debug_server: Thread 614 entered the debugger: Segment violation
KERN: stack trace, current PC 0x608acc  __pthread_cleanup_pop_handler + 0x28:
KERN:   (0x78106f6c)  0x38500
KERN: vm_soft_fault: va 0x28000 not covered by area in address space
KERN: vm_page_fault: vm_soft_fault returned error 'Bad address' on fault at 0x28600, ip 0x8011f61b, write 0, user 0, thread 0x269
KERN: vm_soft_fault: va 0x9000 not covered by area in address space
KERN: vm_page_fault: vm_soft_fault returned error 'Bad address' on fault at 0x9904, ip 0x961514, write 0, user 1, thread 0x26c
KERN: vm_page_fault: thread "w:100:Unnamed Window" (620) in team "app_server" (102) tried to read address 0x9904, ip 0x961514 ("libroot.so_seg0ro" +0xa1514)
KERN: debug_server: Thread 620 entered the debugger: Segment violation
KERN: stack trace, current PC 0x961514  hoardSbrk__8BPrivatel + 0x60:
KERN:   (0x70a3ad6c)  0x9652ad  makeSuperblock__Q28BPrivate10superblockiPQ28BPrivate11processHeap + 0x2a5
KERN:   (0x70a3ad9c)  0x965da4  malloc__Q28BPrivate10threadHeapUl + 0xa6c
KERN:   (0x70a3adec)  0x9660cd  malloc + 0x151
KERN:   (0x70a3ae1c)  0x8e43e1  __builtin_new + 0x29
KERN:   (0x70a3ae4c)  0x8e47e8  __builtin_vec_new + 0x20
KERN:   (0x70a3ae7c)  0x2ffa22  allocate_block__Q23aggt19rasterizer_cells_aa1ZQ23agg7cell_aa + 0x86
KERN:   (0x70a3aeac)  0x2fff0a  line__Q23aggt19rasterizer_cells_aa1ZQ23agg7cell_aaiiii + 0x4c2
KERN:   (0x70a3affc)  0x300d7f  line_to__H1ZQ23aggt19rasterizer_cells_aa1ZQ23agg7cell_aa_Q23aggt18rasterizer_sl_clip1ZQ23agg12ras_conv_intRX00ii_v + 0x117
KERN:   (0x70a3b1cc)  0x305a25  line_to_d__Q23aggt22rasterizer_scanline_aa1ZQ23aggt18rasterizer_sl_clip1ZQ23agg12ras_conv_intdd + 0xa1
KERN:   (0x70a3b1fc)  0x305a91  add_vertex__Q23aggt22rasterizer_scanline_aa1ZQ23aggt18rasterizer_sl_clip1ZQ23agg12ras_conv_intddUi + 0x59
KERN:   (0x70a3b23c)  0x30de5e  _StrokePath__H1ZQ23agg12rounded_rect_C7PainterRX01_5BRect + 0x25a
KERN:   (0x70a3b35c)  0x2f8b02  StrokeRoundRect__C7PainterRC5BRectff + 0x13a
KERN:   (0x70a3b55c)  0x2eca6a  DrawRoundRect__13DrawingEngineG5BRectffb + 0x1ba
KERN:   (0x70a3b5cc)  0x29f485  _DispatchViewDrawingMessage__12ServerWindowlRQ28BPrivate12LinkReceiver + 0xde9
KERN:   (0x70a3cc3c)  0x29e44a  _DispatchViewMessage__12ServerWindowlRQ28BPrivate12LinkReceiver + 0x213a
KERN:   (0x70a3cdcc)  0x29c255  _DispatchMessage__12ServerWindowlRQ28BPrivate12LinkReceiver + 0x1279
KERN:   (0x70a3cefc)  0x2a2bc0  _MessageLooper__12ServerWindow + 0x27c
KERN:   (0x70a3cf7c)  0x27f638  _message_thread__13MessageLooperPv + 0x28
KERN:   (0x70a3cfac)  0x8ea893  thread_entry + 0x23
KERN: Welcome to Kernel Debugging Land...
KERN: Thread 467 "consoled" running on CPU 0
KERN: stack trace for thread 467 "consoled"
KERN:     kernel stack: 0x820df000 to 0x820e3000
KERN:       user stack: 0x7efef000 to 0x7ffef000
KERN: frame               caller     <image>:function + offset
KERN:  0 820e2980 (+  32) 8012c3a2   <kernel_x86> arch_debug_stack_trace + 0x12
KERN:  1 820e29a0 (+  16) 800918bf   <kernel_x86> stack_trace_trampoline(NULL) + 0x0b
KERN:  2 820e29b0 (+  12) 8011f6d2   <kernel_x86> arch_debug_call_with_fault_handler + 0x1b
KERN:  3 820e29bc (+  48) 80093392   <kernel_x86> debug_call_with_fault_handler + 0x5e
KERN:  4 820e29ec (+  64) 80091adf   <kernel_x86> kernel_debugger_loop(0x801619f7 "PANIC: ", 0x80170b00 "page %p has mapping for area %p (%#lx), but has no page table entry", 0x820e2a98 ", int32: 0) + 0x21b
KERN:  5 820e2a2c (+  48) 80091e43   <kernel_x86> kernel_debugger_internal(0x801619f7 "PANIC: ", 0x80170b00 "page %p has mapping for area %p (%#lx), but has no page table entry", 0x820e2a98 ", int32: 0) + 0x53
KERN:  6 820e2a5c (+  48) 8009371e   <kernel_x86> panic + 0x36
KERN:  7 820e2a8c (+  96) 80125d68   <kernel_x86> X86VMTranslationMap32Bit<0x80beb080>::UnmapArea(VMArea*: 0x80bff870, true) + 0x220
KERN:  8 820e2aec (+  64) 801048b0   <kernel_x86> delete_area(VMAddressSpace*: 0x80bd9380, VMArea*: 0x80bff870, true) + 0xb8
KERN:  9 820e2b2c (+  48) 8010686d   <kernel_x86> vm_delete_areas + 0x61
KERN: 10 820e2b5c (+  48) 80112c13   <kernel_x86> VMAddressSpace<0x80bd9380>::RemoveAndPut(0x2) + 0x3f
KERN: 11 820e2b8c (+  80) 80074a08   <kernel_x86> team_delete_team + 0x1c0
KERN: 12 820e2bdc (+ 640) 8007c652   <kernel_x86> thread_exit + 0xae6
KERN: 13 820e2e5c (+ 256) 800675cb   <kernel_x86> handle_signals + 0xb63
KERN: 14 820e2f5c (+  64) 8007ceec   <kernel_x86> thread_at_kernel_exit + 0x14
KERN: 15 820e2f9c (+  12) 80122465   <kernel_x86> kernel_exit_handle_signals + 0x06
KERN: user iframe at 0x820e2fa8 (end = 0x820e3000)
KERN:  eax 0x10fc        ebx 0x11457c       ecx 0x7ffed680  edx 0xffff0114
KERN:  esi 0x116004      edi 0x10fc         ebp 0x7ffedaac  esp 0x820e2fdc
KERN:  eip 0x1047c3   eflags 0x13207   user esp 0x7ffeda74
KERN:  vector: 0xe, error code: 0x4
KERN: 16 820e2fa8 (+   0) 001047c3
KERN: 17 7ffedaac (+  48) 00104ce6
KERN: 18 7ffedadc (+5248) 00103181
KERN: 19 7ffeef5c (+   0) 0000ff00
KERN: 00004400 -- read fault
Attachments (1)
Change History (21)
follow-up: 3 comment:1 by , 11 years ago
comment:2 by , 11 years ago
| Cc: | added |
|---|
follow-up: 5 comment:3 by , 11 years ago
comment:4 by , 11 years ago
| Cc: | removed |
|---|
follow-up: 6 comment:5 by , 11 years ago
Replying to bonefish:
Unfortunately the
panic()message is missing, but the stack trace looks like that in #8412.
Actually it's retrievable, c.f.
KERN: 5 820e2a2c (+ 48) 80091e43 <kernel_x86> kernel_debugger_internal(0x801619f7 "PANIC: ", 0x80170b00 "page %p has mapping for area %p (%#lx), but has no page table entry", 0x820e2a98 ", int32: 0) + 0x53
You're right though, the backtrace does appear more like that in #8412, on initial search I'd found that same panic message in #5413 so I'd mistakenly assumed the later ones were duplicates. Should I close this as a dupe of #8412 then, or leave open?
comment:6 by , 11 years ago
| Keywords: | vm added |
|---|
follow-up: 9 comment:7 by , 11 years ago
If of interest, the steps in the ticket in and of itself don't directly reproduce the panic here, but I'm able to get a similar panic with some slight changes: switching the input frequency a few times here results in high cpu usage from syslog daemon, which turns out to be due to hda reporting errors adjusting its fifos. Doing so enough times results in the media preflet hanging and needing to be killed. If I then kill media server/media add-on server, I get a panic with a similar backtrace as here, but this time it's the page in cache still has mappings panic. Anything I can do to try to help narrow down what's going on here?
comment:8 by , 11 years ago
After leaving only one core enabled in ProcessController panic message has changed to "page fault in debugger without fault handler!"
comment:9 by , 11 years ago
Replying to anevilyak:
If I then kill media server/media add-on server, I get a panic with a similar backtrace as here, but this time it's the page in cache still has mappings panic. Anything I can do to try to help narrow down what's going on here?
Unfortunately there isn't any kernel tracing for creation/deletion of page mappings. That needs to be added to reconstruct what happened with the page mapping in question.
comment:11 by , 10 years ago
hrev46491 only introduces looking up the current state. However, the tracing in question had already been introduced in 372a66634410cf0450e426716c14ad42d40c0da4 and has thus been available in master since hrev46113. It can be activated in the the tracing config header (macros TRANSLATION_MAP_TRACING[_STACK_TRACE]). A large tracing buffer is recommended.
comment:12 by , 10 years ago
| Cc: | added |
|---|
I wonder if this was fixed with hrev47800. Commit message says that hda driver was overwriting random kernel memory which might explain crashes in random components from the description. Unfortunately, I won't have access to this PC for some time to test it myself.
comment:13 by , 7 years ago
| patch: | 0 → 1 |
|---|
comment:14 by , 7 years ago
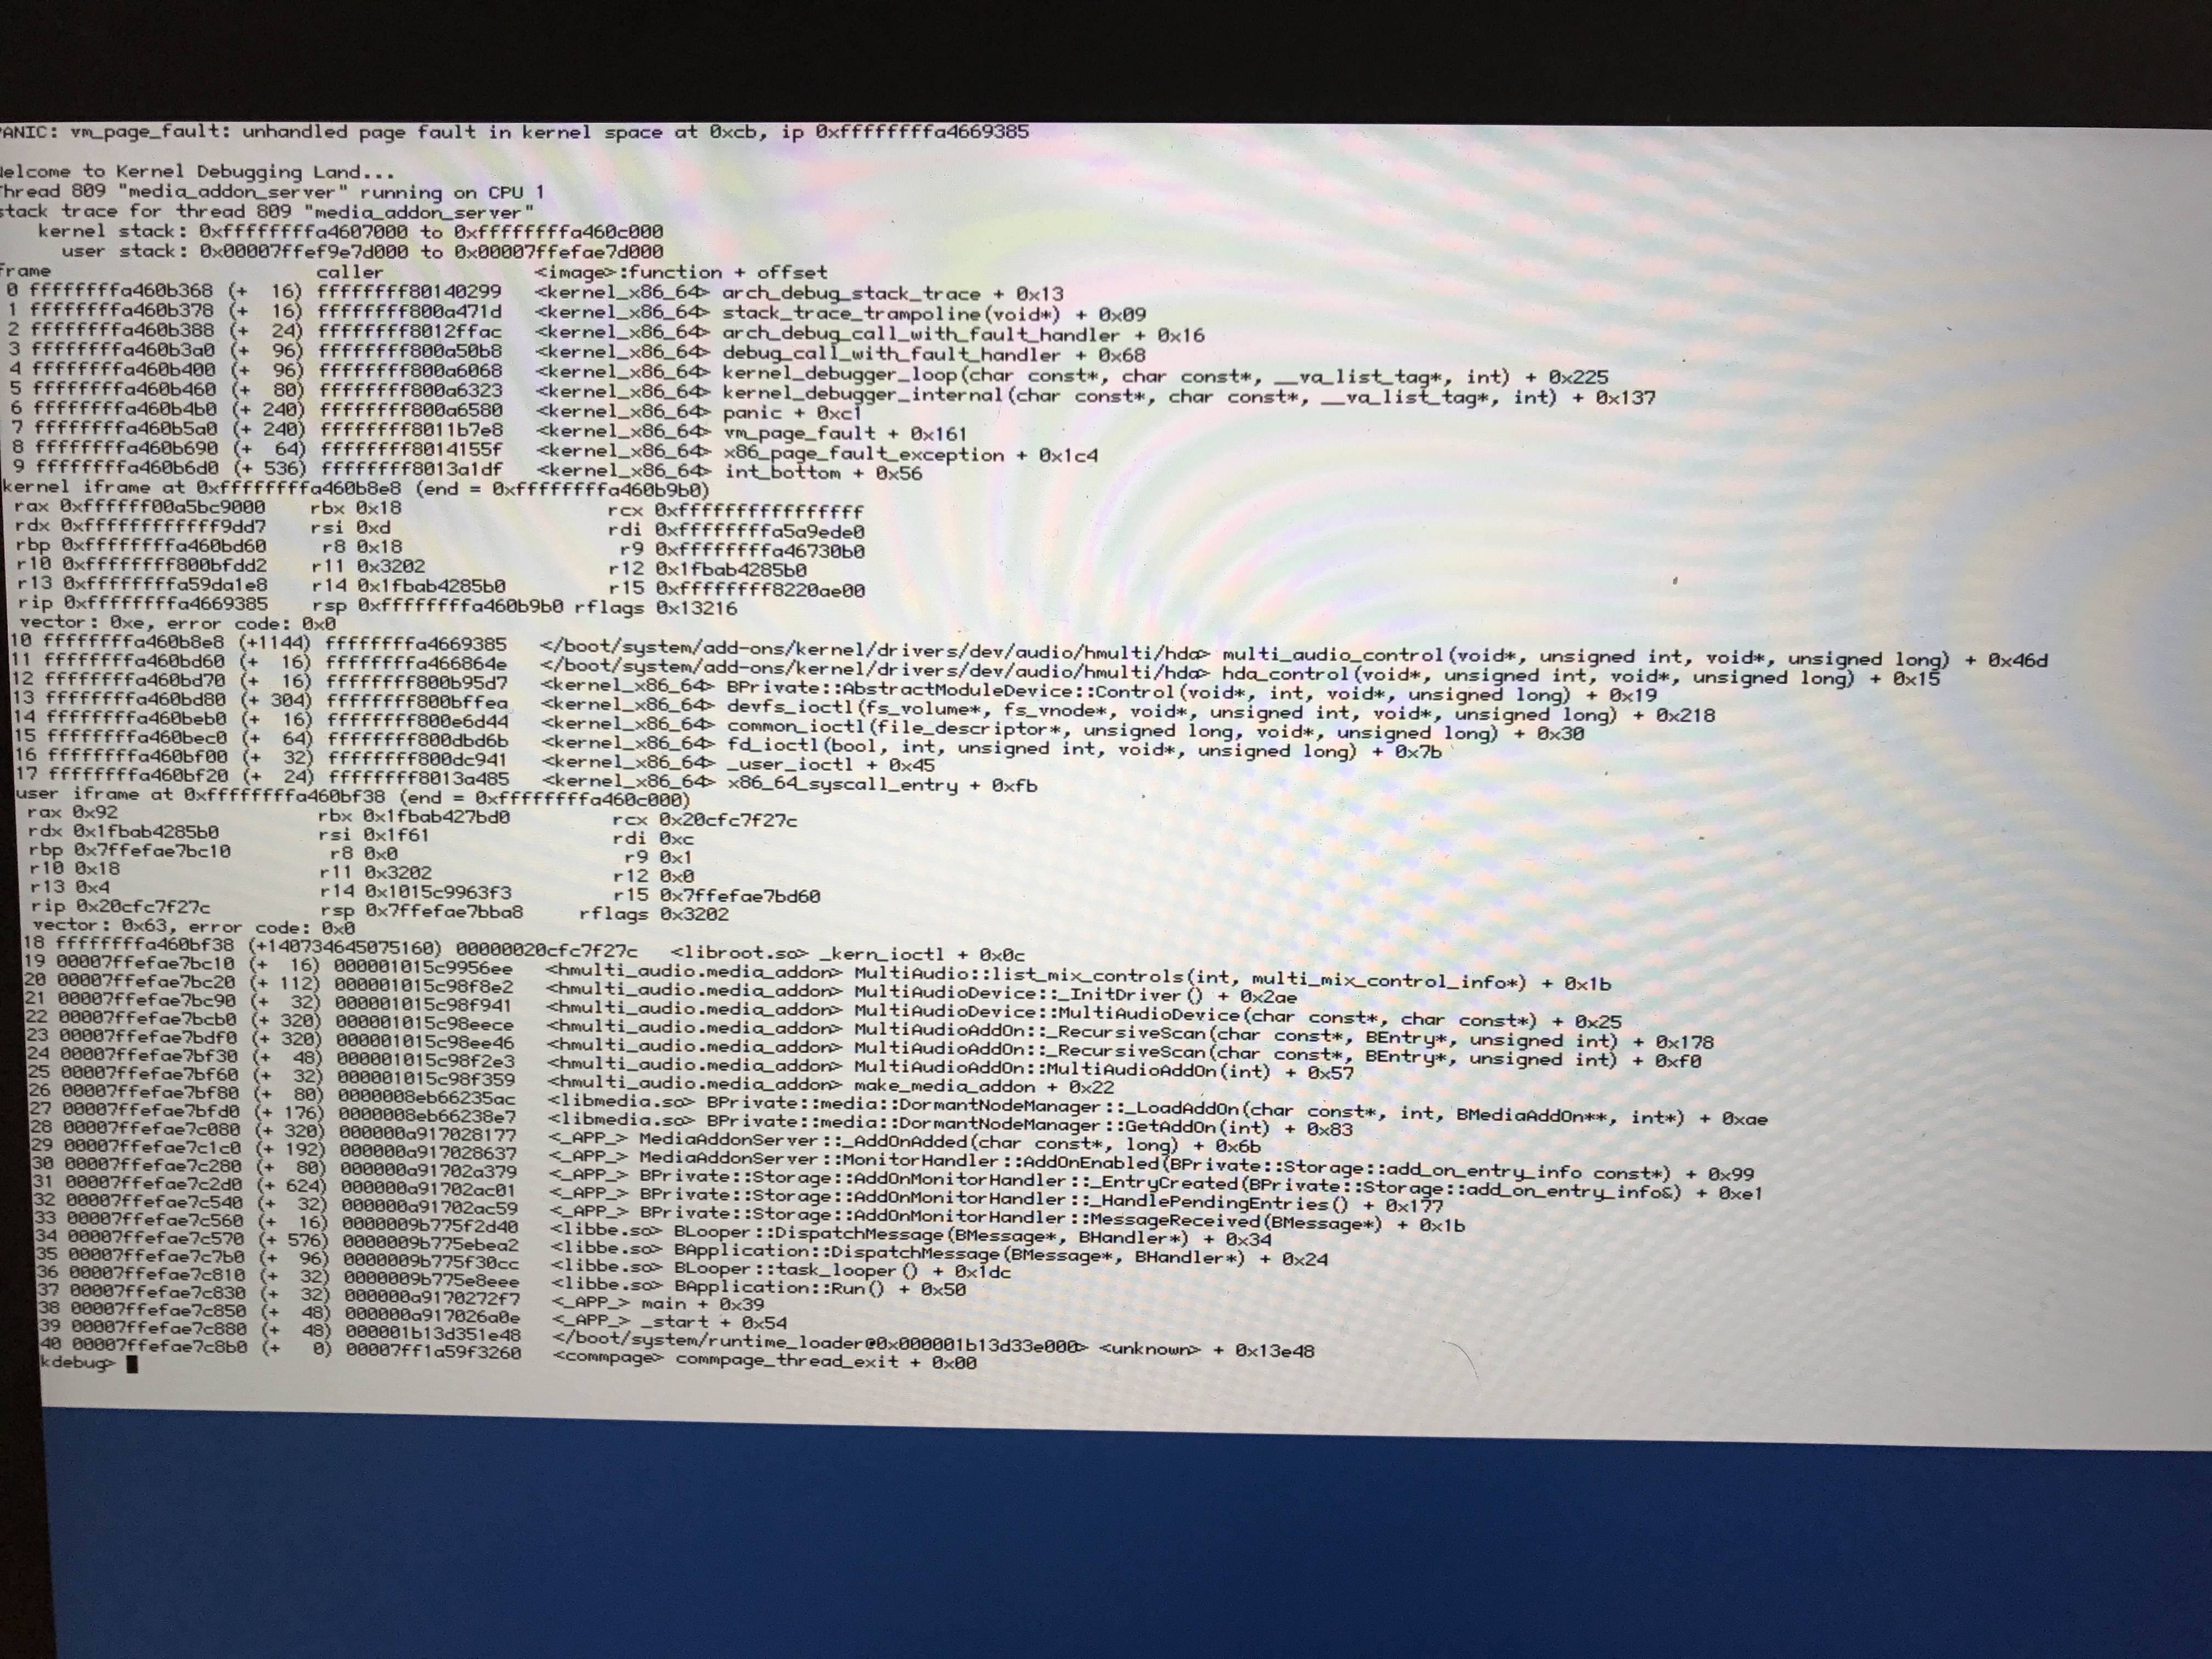
Added attachment (comment 13, IMG_5396.JPG) without comment - sorry.
Haiku Rev 51205 (gcc2_h) 32 bit works with hda driver on MacBookPro 11.3. First I need to boot into OSX, then reboot, then I can hear sound through the headphone jack. Without first booting into OSX, I get no sound.
The exact same Haiku Rev 51205, on x86_64 (64 bit) produces the kernel panic (vm_page_fault) in the attachment in comment 13. Blacklisting the hda driver allows the system to boot. This is the first time I ever booted x86_64 version of Haiku, so I don't know how long this problem existed.
Hopefully this configuration (same source, 32 bit OK, 64 bit panics) can shed some more insight into the memory access bug which has been impacting this driver for a while)
comment:15 by , 7 years ago
| patch: | 1 → 0 |
|---|
comment:16 by , 6 years ago
Hmpf, I have a similar backtrace on 32bit:
vm_page_fault: vm_soft_fault returned error 'Permission denied' on fault at 0xd9eaf254, ip 0x116d611, write 1, user 1, thread 0xc1f
vm_page_fault: thread "w:2853:offscreen" (3103) in team "app_server" (393) tried to write address 0xd9eaf254, ip 0x116d611 ("???" +0x116d611)
debug_server: Thread 3103 entered the debugger: Segment violation
stack trace, current PC 0x116d611  freeBlock__Q28BPrivate9hoardHeapRPQ28BPrivate5blockRPQ28BPrivate10superblockiPQ28BPrivate11processHeap + 0x335:
  (0x71b9a2cc)  0x116fe9e  free + 0xae
  (0x71b9a2fc)  0x10e3760  __builtin_vec_delete + 0x24
  (0x71b9a32c)  0x16c1bff  _._Q23aggt11pod_bvector2ZQ23aggt10point_base1ZdUi6 + 0x3f
  (0x71b9a35c)  0x1752efb  _StrokePath__H1ZQ23aggt9path_base1ZQ23aggt20vertex_block_storage3ZdUi8Ui256_C7PainterRX018cap_mode_5BRect + 0xff
  (0x71b9a448)  0x1753064  _StrokePath__H1ZQ23aggt9path_base1ZQ23aggt20vertex_block_storage3ZdUi8Ui256_C7PainterRX01_5BRect + 0x2c
  (0x71b9a478)  0x174487e  StrokeLine__7PainterG6BPointT1 + 0x50e
  (0x71b9a558)  0x173b909  StrokeLineArray__13DrawingEnginelPC17ViewLineArrayInfo + 0x3b9
  (0x71b9a5f8)  0x16f3db7  _DispatchViewDrawingMessage__12ServerWindowlRQ28BPrivate12LinkReceiver + 0x417f
  (0x71b9bd38)  0x16ef72a  _DispatchViewMessage__12ServerWindowlRQ28BPrivate12LinkReceiver + 0x38d2
  (0x71b9c068)  0x16ebd66  _DispatchMessage__12ServerWindowlRQ28BPrivate12LinkReceiver + 0x12ce
  (0x71b9c198)  0x16f6ebc  _MessageLooper__12ServerWindow + 0x258
  (0x71b9c218)  0x16ca9d0  _message_thread__13MessageLooperPv + 0x28
  (0x71b9c248)  0x10ed077  thread_entry + 0x23
Not sure if it fits in this, report because it was unrelated to hda, simply a system under load.
comment:18 by , 6 years ago
| Milestone: | R1 → R1/beta2 |
|---|
comment:19 by , 5 years ago
| Resolution: | → fixed |
|---|---|
| Status: | new → closed |
smallstepforman, your panic is a NULL dereference in HDA itself, not an assert failure in the VM system. As nobody else has seen this, then yes, jua's change to the DMA engine probably fixed it.
comment:20 by , 5 years ago
| Cc: | added |
|---|
(for my archives: comment 7's note about syslog/fifo sounds a lot like Dane running CC6 on R1B1 and getting his syslog hammered by fifo notices until bfs blows up)
FYI that looks like the same panic as #5413, though the cause may or may not be related.