

Opened 18 years ago
Last modified 22 months ago
#1074 assigned enhancement
Identify and fix performance bottlenecks in our app_server
| Reported by: | axeld | Owned by: | jua |
|---|---|---|---|
| Priority: | normal | Milestone: | R1.1 |
| Component: | Servers/app_server | Version: | |
| Keywords: | Cc: | kaoutsis | |
| Blocked By: | Blocking: | ||
| Platform: | All |
Description
The current app_server implementation is mostly not optimized yet. As this is actually noticeable, and we aren't that close to the speed of BeOS R5 yet, this should be changed, though :-)
Attachments (1)
Change History (41)
comment:1 by , 18 years ago
| Cc: | added |
|---|
comment:2 by , 18 years ago
comment:3 by , 18 years ago
| Cc: | added; removed |
|---|
Well, you'd have to use a profiler and compile with profiling options. Stephan has already done some profiling. I think you need to add this to the Jamfiles for the app_server (Ingo will know better):
{
	SubDirCcFlags -pg ;
	SubDirC++Flags -pg ;
}
I also found a short intro to this topic. I've rarely used profilers, though, and I don't know if you will also need to set linker flags in the Jamfile. You could just try and see if it works. I suggest that you ask on the main mailing list if you need more (=better ;) help.
comment:4 by , 18 years ago
It will also require us to measure the impact of context switches, and to find ways to reduce their cost (ie. by trying to make sure that drawing threads always use their full quantum if there is something left to draw).
follow-up: 9 comment:5 by , 18 years ago
The SubDirCcFlags/SubDirC++Flags should work. You can also add the compiler flags in your build/jam/UserBuildConfig file, which is the recommended way, since you don't need to meddle with any Jamfiles that are under version control. To add the "-pg" flag in src/servers/app and all subdirectories use the following:
  AppendToConfigVar CCFLAGS : HAIKU_TOP src servers app : -pg : global ;
  AppendToConfigVar C++FLAGS : HAIKU_TOP src servers app : -pg : global ;
If you want to add it only for specific directories, replace the "global" by "local" and add respective lines for the directories you're interested in.
comment:6 by , 18 years ago
Does the profiling switches -pg working for sure in gcc 2.95.3-beos-060710 ? If i enable the switches, it seems that i can not produce gmon.out: $ gprof -v GNU gprof 2.15 $ gprof MyCompiledAndLinkedWithProf gmon.out: No such file or directory
follow-up: 8 comment:7 by , 18 years ago
Did you run the app before you started the profiler? I.e.: $ MyCompiledAndLinkedWithProf $ gprof MyCompiledAndLinkedWithProf
follow-up: 12 comment:9 by , 18 years ago
follow-up: 11 comment:10 by , 18 years ago
You're misusing gprof :-) You're supposed to run the executable, and quit it (killing it won't help), then it writes out a file called something like profile* - and *that* file is the one you have to use gprof on. Because of these semantics, you can more or less only use profiling in the app_server test environment. Or write your own profiling code (instead of using the one provided by i386-mcount.o).
comment:11 by , 18 years ago
Replying to axeld:
You're misusing gprof :-)
this is a nice opportunity to clear this issue: a) i follow this guide http://www.network-theory.co.uk/docs/gccintro/gccintro_80.html that Waldemar kindly provided. Doesn't working on hrev5 as described, (did i miss something?) but i believe on linux it would (i will test it tomorrow to be sure). b) I just found this: taken from our old newsletter issue 20: [...] Daniel Reinhold writes: [...] There is a GNU profiler that is included with many POSIX systems called 'gprof'. It is included with BeOS R5 as well (or at least with the developer tools mentioned above), but frankly, it doesn't work. However, Be did provide their own profiler called "profile". [...] Could you please clear the situation: Does gprof working on hrev5, should we use be's profile, or we may use Daniel's Ezprof (it is working fine), and we may extend to fit our needs?
You're supposed to run the executable, and quit it (killing it won't help),
Yes, i already do that, ...
then it writes out a file called something like profile* -
Yes, this file is generated...
and *that* file is the one you have to use gprof on.
How?
Because of these semantics, you can more or less only use profiling in the app_server test environment. Or write your own profiling code (instead of using the one provided by i386-mcount.o).
That is a very important information to go on. Thanks!
follow-up: 13 comment:12 by , 18 years ago
Replying to kaoutsis:
Replying to bonefish: Very elegant. Now something to finish that work for linking: in my hrev5 & gcc 2.95.3-beos-060710 need to link with /boot/develop/lib/x86/i386-mcount.o to resolve the profiling symbols.
Just use the LinkAgainst rule to add it:
LinkAgainst app_server : /boot/develop/lib/x86/i386-mcount.o ;
Note, that the dependency is old, so the first time you might need to remove the generated executable or otherwise trigger re-linking.
comment:14 by , 18 years ago
gprof is working perfectly on linux, as described in the Waldemar's short info (but unfortunately not on hrev5). Also gprof is found in binutils package.
comment:15 by , 18 years ago
Sorry, my bad. Under BeOS, you can just use "bprof" instead of "gprof"; usage is the same.
follow-ups: 24 35 comment:16 by , 18 years ago
Hi,
if someone manages to get gprof/bprof working properly on R5 (for use in the test environment), that would be great. Don't forget to tell me how... :-)
I did manage to get some useful info from ezprof, but I fixed all issues to the point that the info retrieved from ezprof is now pretty much inconclusive.
I have thought very much about the performance issues, and have come to the conclusion, that the problem could very well be in the way "update sessions" work. Currently, the app_server maintains repainting on the *window* level of things. There are two update sessions (per window): a current and a pending update session. The client window paints views in the current update session which touch the dirty region. The problem here is, that the mechanism is probably too "coarse": The update session cannot grow after the window has been informed that repainting needs to be done. So additional dirty regions are placed in the next (pending) update session. When the window finally gets to repainting a particular view after having painted a few views, large portions of it might already be dirty in the next update session. So it has to be painted again. If the update sessions worked on the *view* level, instead of the window level (as seems to be the case in R5, since there is one update message per view), the dirty region (for each view) might grow for a much longer time on the server side (while the client window is busy painting other views), and the window might have to paint the view only once.
I have yet to think of a way, how the update stuff can be moved to the view level, without wasting too much resources for all those regions. But I think this is defenitely one very important reason for the current "slowness" of the app_server. The drawing speed itself is likely not the problem for the majority of the views you see during typical use.
HTH, Stephan
comment:17 by , 18 years ago
I also made some research about ezprof, since i am interesting to make it working in haiku also. The main problem about ezprof is well... speed. From my point of view, if ezprof can speed up, is very useful. To give an example of slowness: i take the collatz.c from http://www.network-theory.co.uk/docs/gccintro/gccintro_80.html for examing with ezprof and the results were the same as gprof (in linux), with a difference: ezprof take 3 hours! to complete. The "profile" the most speedy profiling tool (is a tool that comes with bprof) give the same results to the same machine in 20 seconds. ps: i guess collatz.c is the test for profilers:-)
bye,
Vasilis
comment:18 by , 18 years ago
"profile" is using a very different concept, though: it just periodically checks where the executable is and counts the functions. That's very cheap, but also very inexact. Also, profilers that work via instrumenting like ezprof make function calls much more expensive, and thus, may distort the results.
comment:19 by , 15 years ago
| Cc: | removed |
|---|---|
| Owner: | changed from to |
| Version: | R1/pre-alpha1 |
comment:20 by , 8 years ago
| Owner: | changed from to |
|---|---|
| Status: | new → assigned |
comment:21 by , 6 years ago
Is it worth leaving this open? We can open new tickets for specific still-existing issues.
follow-up: 37 comment:23 by , 4 years ago
Well, the conclusions in https://dev.haiku-os.org/ticket/1074#comment:16 should be turned into a new ticket if still applicable. Other than that, yes, this seems quite open-ended and not really useful.
comment:24 by , 4 years ago
Replying to stippi:
I have yet to think of a way, how the update stuff can be moved to the view level, without wasting too much resources for all those regions.
It is not possible because all views in a window share same thread and it can't be changed without breaking API behavior. Instead of this, dirty region collection can be improved.
comment:25 by , 4 years ago
I run test with small window (4x4 pixels, no border) and placeholder view that call BView::Invalidate at end of BView::Draw. profile results:
profiling results for thread "w:2284:TestApp" (2287):
  tick interval:  1000 us
  total ticks:    27072 (27072000 us)
  unknown ticks:  0 (0 us,   0.00%)
  dropped ticks:  0 (0 us,   0.00%)

        hits     unknown    image
  ------------------------------------------------------------------------------
        7154           0        1 kernel_x86_64
        7336           0     3078 /boot/system/servers/app_server
        2742           0     3080 /boot/system/lib/libbe.so
          56           0     3100 /boot/system/lib/libstdc++.so.6.0.25
        9784           0     3101 /boot/system/lib/libroot.so

        hits       in us    in %   image  function
  ------------------------------------------------------------------------------
        6080     6080000   22.46    3101  system_time
        3199     3199000   11.82    3078  Window::BeginUpdate(BPrivate::PortLink&)
        2435     2435000    8.99       1  ConditionVariable::_Notify(bool, int)
        1642     1642000    6.07       1  ConditionVariableEntry::Wait(unsigned int, long)
         737      737000    2.72       1  x86_64_syscall_entry
         688      688000    2.54       1  _mutex_lock
         681      681000    2.52    3101  __mutex_lock
         570      570000    2.11    3101  __mutex_unlock
         489      489000    1.81    3080  agg::math_stroke<agg::pod_bvector<agg::point_base<double>, 6u> >::calc_miter(agg::pod_bvector<agg::point_base<double>, 6u>&, agg::vertex_dist const&, agg::vertex_dist const&, agg::vertex_dist const&, double, double, double, double, agg::line_join_e, double)
         458      458000    1.69       1  _mutex_unlock
         431      431000    1.59    3101  BPrivate::hoardHeap::findAvailableSuperblock(int, BPrivate::block*&, BPrivate::processHeap*)
         422      422000    1.56    3078  void agg::render_scanlines<agg::rasterizer_scanline_aa<agg::rasterizer_sl_clip<agg::ras_conv_int> >, agg::scanline_p8, agg::renderer_scanline_aa_solid<agg::renderer_region<PixelFormat> > >(agg::rasterizer_scanline_aa<agg::rasterizer_sl_clip<agg::ras_conv_int> >&, agg::scanline_p8&, agg::renderer_scanline_aa_solid<agg::renderer_region<PixelFormat> >&)
         352      352000    1.30    3080  agg::vcgen_stroke::vertex(double*, double*)
         317      317000    1.17    3101  BPrivate::hoardHeap::freeBlock(BPrivate::block*&, BPrivate::superblock*&, int, BPrivate::processHeap*)
         270      270000    1.00    3078  agg::conv_adaptor_vcgen<agg::path_base<agg::vertex_block_storage<double, 8u, 256u> >, agg::vcgen_stroke, agg::null_markers>::vertex(double*, double*)
...
system_time seems to be quite slow. Window::BeginUpdate probably can be also optimized.
comment:26 by , 4 years ago
system_time uses uint128_t on x86_64: https://xref.landonf.org/source/xref/haiku/src/system/libroot/os/arch/x86_64/system_time.cpp#27
Possibly this can be optimized like the bootloader one was? But that still seems odd.
follow-up: 28 comment:27 by , 4 years ago
Can you use profile -f to get the full call stacks? This should then show what is calling system_time so often, as well as other things that a profile without -f often misses.
comment:28 by , 4 years ago
Replying to waddlesplash:
Can you use
profile -fto get the full call stacks? This should then show what is calling system_time so often, as well as other things that a profile without -f often misses.
profiling results for thread "w:1250:TestApp" (1253):
  tick interval:  1000 us
  total ticks:    43459 (43459000 us)
  unknown ticks:  0 (0 us,   0.00%)
  dropped ticks:  0 (0 us,   0.00%)
  samples/tick:   10.4

        hits     unknown    image
  ------------------------------------------------------------------------------
        8832           0        1 kernel_x86_64
       43459           0     3078 /boot/system/servers/app_server
       16303           0     3080 /boot/system/lib/libbe.so
        2350           0     3100 /boot/system/lib/libstdc++.so.6.0.25
       43459           0     3101 /boot/system/lib/libroot.so
       60161           0       51 commpage

        hits       in us    in %   image  function
  ------------------------------------------------------------------------------
       43459    43459000  100.00    3078  MessageLooper::_message_thread(void*)
       43459    43459000  100.00    3101  thread_entry
       43244    43244000   99.51    3078  ServerWindow::_MessageLooper()
       35525    35525000   81.74    3078  ServerWindow::_DispatchMessage(int, BPrivate::LinkReceiver&)
       19138    19138000   44.04    3078  Window::BeginUpdate(BPrivate::PortLink&)
       13539    13539000   31.15    3078  ServerWindow::_DispatchViewMessage(int, BPrivate::LinkReceiver&)
       11922    11922000   27.43    3078  ServerWindow::_DispatchViewDrawingMessage(int, BPrivate::LinkReceiver&)
       11447    11447000   26.34    3101  system_time
       10172    10172000   23.41    3078  BRect Painter::_StrokePath<agg::path_base<agg::vertex_block_storage<double, 8u, 256u> > >(agg::path_base<agg::vertex_block_storage<double, 8u, 256u> >&, cap_mode) const
        8949     8949000   20.59    3078  BRect Painter::_RasterizePath<agg::conv_stroke<agg::path_base<agg::vertex_block_storage<double, 8u, 256u> >, agg::null_markers> >(agg::conv_stroke<agg::path_base<agg::vertex_block_storage<double, 8u, 256u> >, agg::null_markers>&) const
        8825     8825000   20.31       1  x86_64_syscall_entry
        6373     6373000   14.66    3080  BPrivate::LinkReceiver::GetNextMessage(int&, long)
        5800     5800000   13.35    3078  agg::conv_adaptor_vcgen<agg::path_base<agg::vertex_block_storage<double, 8u, 256u> >, agg::vcgen_stroke, agg::null_markers>::vertex(double*, double*)
        5779     5779000   13.30    3078  DrawingEngine::StrokeLine(BPoint const&, BPoint const&)
        5638     5638000   12.97    3078  Painter::StrokeLine(BPoint, BPoint)
        5077     5077000   11.68    3078  DrawingEngine::StrokeRect(BRect)
        4931     4931000   11.35    3078  Painter::StrokeRect(BRect const&) const
        4197     4197000    9.66    3080  BPrivate::LinkReceiver::ReadFromPort(long)
        4140     4140000    9.53    3101  _kern_port_buffer_size_etc
        3724     3724000    8.57       1  _user_port_buffer_size_etc
        3712     3712000    8.54       1  _get_port_message_info_etc
        3395     3395000    7.81    3080  agg::vcgen_stroke::vertex(double*, double*)
        2740     2740000    6.30    3101  malloc
        2523     2523000    5.81       1  ConditionVariableEntry::Wait(unsigned int, long)
        2191     2191000    5.04    3101  _kern_write_port_etc
        2171     2171000    5.00    3100  operator new(unsigned long)
        2089     2089000    4.81    3101  BPrivate::threadHeap::malloc(unsigned long)
        2087     2087000    4.80    3101  _kern_read_port_etc
        1997     1997000    4.60       1  _user_write_port_etc
        1931     1931000    4.44       1  writev_port_etc
        1867     1867000    4.30    3101  free
        1829     1829000    4.21       1  _user_read_port_etc
        1792     1792000    4.12       1  read_port_etc
        1771     1771000    4.08       1  ConditionVariable::_Notify(bool, int)
        1703     1703000    3.92    3080  agg::vcgen_stroke::add_vertex(double, double, unsigned int)
        1623     1623000    3.73    3078  Window::_SendUpdateMessage()
        1584     1584000    3.64    3080  agg::vertex_sequence<agg::vertex_dist, 6u>::add(agg::vertex_dist const&)
        1390     1390000    3.20    3080  BRegion::IntersectWith(BRegion const*)
        1318     1318000    3.03       1  _mutex_unlock
        1309     1309000    3.01    3078  void agg::rasterizer_sl_clip<agg::ras_conv_int>::line_to<agg::rasterizer_cells_aa<agg::cell_aa> >(agg::rasterizer_cells_aa<agg::cell_aa>&, int, int)
        1294     1294000    2.98    3078  ServerWindow::SendMessageToClient(BMessage const*, int) const
        1219     1219000    2.80    3101  BPrivate::hoardHeap::findAvailableSuperblock(int, BPrivate::block*&, BPrivate::processHeap*)
        1193     1193000    2.75    3080  agg::math_stroke<agg::pod_bvector<agg::point_base<double>, 6u> >::calc_miter(agg::pod_bvector<agg::point_base<double>, 6u>&, agg::vertex_dist const&, agg::vertex_dist const&, agg::vertex_dist const&, double, double, double, double, agg::line_join_e, double)
        1177     1177000    2.71    3078  agg::rasterizer_scanline_aa<agg::rasterizer_sl_clip<agg::ras_conv_int> >::add_vertex(double, double, unsigned int)
        1131     1131000    2.60    3101  BPrivate::processHeap::free(void*)
         995      995000    2.29    3080  BPrivate::LinkReceiver::HasMessages() const
         965      965000    2.22       1  get_locked_port(int)
         962      962000    2.21    3078  void agg::render_scanlines<agg::rasterizer_scanline_aa<agg::rasterizer_sl_clip<agg::ras_conv_int> >, agg::scanline_p8, agg::renderer_scanline_aa_solid<agg::renderer_region<PixelFormat> > >(agg::rasterizer_scanline_aa<agg::rasterizer_sl_clip<agg::ras_conv_int> >&, agg::scanline_p8&, agg::renderer_scanline_aa_solid<agg::renderer_region<PixelFormat> >&)
         947      947000    2.18    3078  agg::rasterizer_cells_aa<agg::cell_aa>::line(int, int, int, int)
         942      942000    2.17    3101  _kern_port_count
         918      918000    2.11    3080  agg::math_stroke<agg::pod_bvector<agg::point_base<double>, 6u> >::calc_cap(agg::pod_bvector<agg::point_base<double>, 6u>&, agg::vertex_dist const&, agg::vertex_dist const&, double)
         895      895000    2.06    3101  __mutex_lock
         828      828000    1.91    3080  agg::pod_bvector<agg::point_base<double>, 6u>::allocate_block(unsigned int)
         755      755000    1.74       1  _mutex_lock
         755      755000    1.74    3080  BRegion::_SetSize(int)
         749      749000    1.72    3101  __mutex_unlock
         714      714000    1.64    3078  Window::EndUpdate()
         640      640000    1.47    3078  Window::InvalidateView(View*, BRegion&)
         535      535000    1.23    3101  BPrivate::hoardHeap::freeBlock(BPrivate::block*&, BPrivate::superblock*&, int, BPrivate::processHeap*)
         501      501000    1.15    3080  agg::math_stroke<agg::pod_bvector<agg::point_base<double>, 6u> >::calc_join(agg::pod_bvector<agg::point_base<double>, 6u>&, agg::vertex_dist const&, agg::vertex_dist const&, agg::vertex_dist const&, double, double)
         496      496000    1.14    3080  BRegion::_AdoptRegionData(BRegion&)
         462      462000    1.06    3078  Window::VisibleContentRegion()
         452      452000    1.04    3078  ServerWindow::_UpdateCurrentDrawingRegion()
         435      435000    1.00    3078  HWInterface::InvalidateRegion(BRegion&)
...
comment:29 by , 4 years ago
system_time with int128 as it currently exists:
0000000000000010 <system_time>:
  10:   0f 31                   rdtsc
  12:   48 c1 e2 20             shl    $0x20,%rdx
  16:   48 09 d0                or     %rdx,%rax
  19:   48 f7 25 00 00 00 00    mulq   0x0(%rip)        # 20 <system_time+0x10>
  20:   48 89 d0                mov    %rdx,%rax
  23:   c3                      retq
system_time with the logic as used in the bootloader involving uint64:
0000000000000010 <system_time>:
  10:   0f 31                   rdtsc
  12:   48 8b 0d 00 00 00 00    mov    0x0(%rip),%rcx        # 19 <system_time+0x9>
  19:   48 c1 e2 20             shl    $0x20,%rdx
  1d:   48 09 d0                or     %rdx,%rax
  20:   89 c2                   mov    %eax,%edx
  22:   48 c1 e8 20             shr    $0x20,%rax
  26:   48 0f af d1             imul   %rcx,%rdx
  2a:   48 0f af c1             imul   %rcx,%rax
  2e:   48 c1 ea 20             shr    $0x20,%rdx
  32:   48 01 d0                add    %rdx,%rax
  35:   c3                      retq
So the uint128 version is actually fewer instructions, so unless imul is somehow significantly faster than mulq, the current version is faster.
follow-up: 32 comment:31 by , 4 years ago
Do you mean you enabled PROFILE_TIMING in app_server? Most of the system_time calls are behind that. It still seems rather strange.
comment:32 by , 4 years ago
Replying to waddlesplash:
Do you mean you enabled PROFILE_TIMING in app_server? Most of the system_time calls are behind that. It still seems rather strange.
No, this is regular app_server, not test_app_server and no additional debug options were used.
comment:33 by , 4 years ago
Well, I'm not sure where all these calls are coming from then: https://xref.landonf.org/source/search?q=system_time&defs=&refs=&path=servers+app+-tests&hist=&type=&project=haiku
Note most of those are behind disabled #ifs.
comment:34 by , 4 years ago
I benchmarked both system_time versions and libroot one seems a bit faster:
system_time_libroot: 133254624 calls/sec
system_time_boot: 130536885 calls/sec
Assembly is the same as above.
comment:35 by , 4 years ago
Replying to stippi:
If the update sessions worked on the *view* level, instead of the window level (as seems to be the case in R5, since there is one update message per view)
BeOS seems to do the same thing as Haiku, updates are managed on per-window, not per-view level:
fd04213c   80005d0c  TestView::Draw(BRect) + 00000028
fd042188   ec223731  BWindow::do_draw_views(void) + 0000026d
fd0421e0   ec2256b6  BWindow::DispatchMessage(BMessage *, BHandler *) + 000005a6
fd042240   ec2244be  BWindow::task_looper(void) + 00000362
fd04228c   ec16ce96  BLooper::_task0_(void *) + 00000036
fd0422a0   ec08558d  thread_start + 00000039
comment:36 by , 4 years ago
I managed to run BeOS in VMware player without major speed drop. Now speed is comparable to Haiku, thread switching score (#15509):
BeOS: 25812.424108
Haiku: 28583.646038
BeOS app_server feels faster than Haiku.
comment:37 by , 4 years ago
Replying to pulkomandy:
Well, the conclusions in https://dev.haiku-os.org/ticket/1074#comment:16 should be turned into a new ticket if still applicable. Other than that, yes, this seems quite open-ended and not really useful.
Done it #16356. However, I did't notice there has been a lengthy discussion after your comment.
comment:38 by , 4 years ago
| Milestone: | R1 → R1.1 |
|---|
comment:39 by , 22 months ago
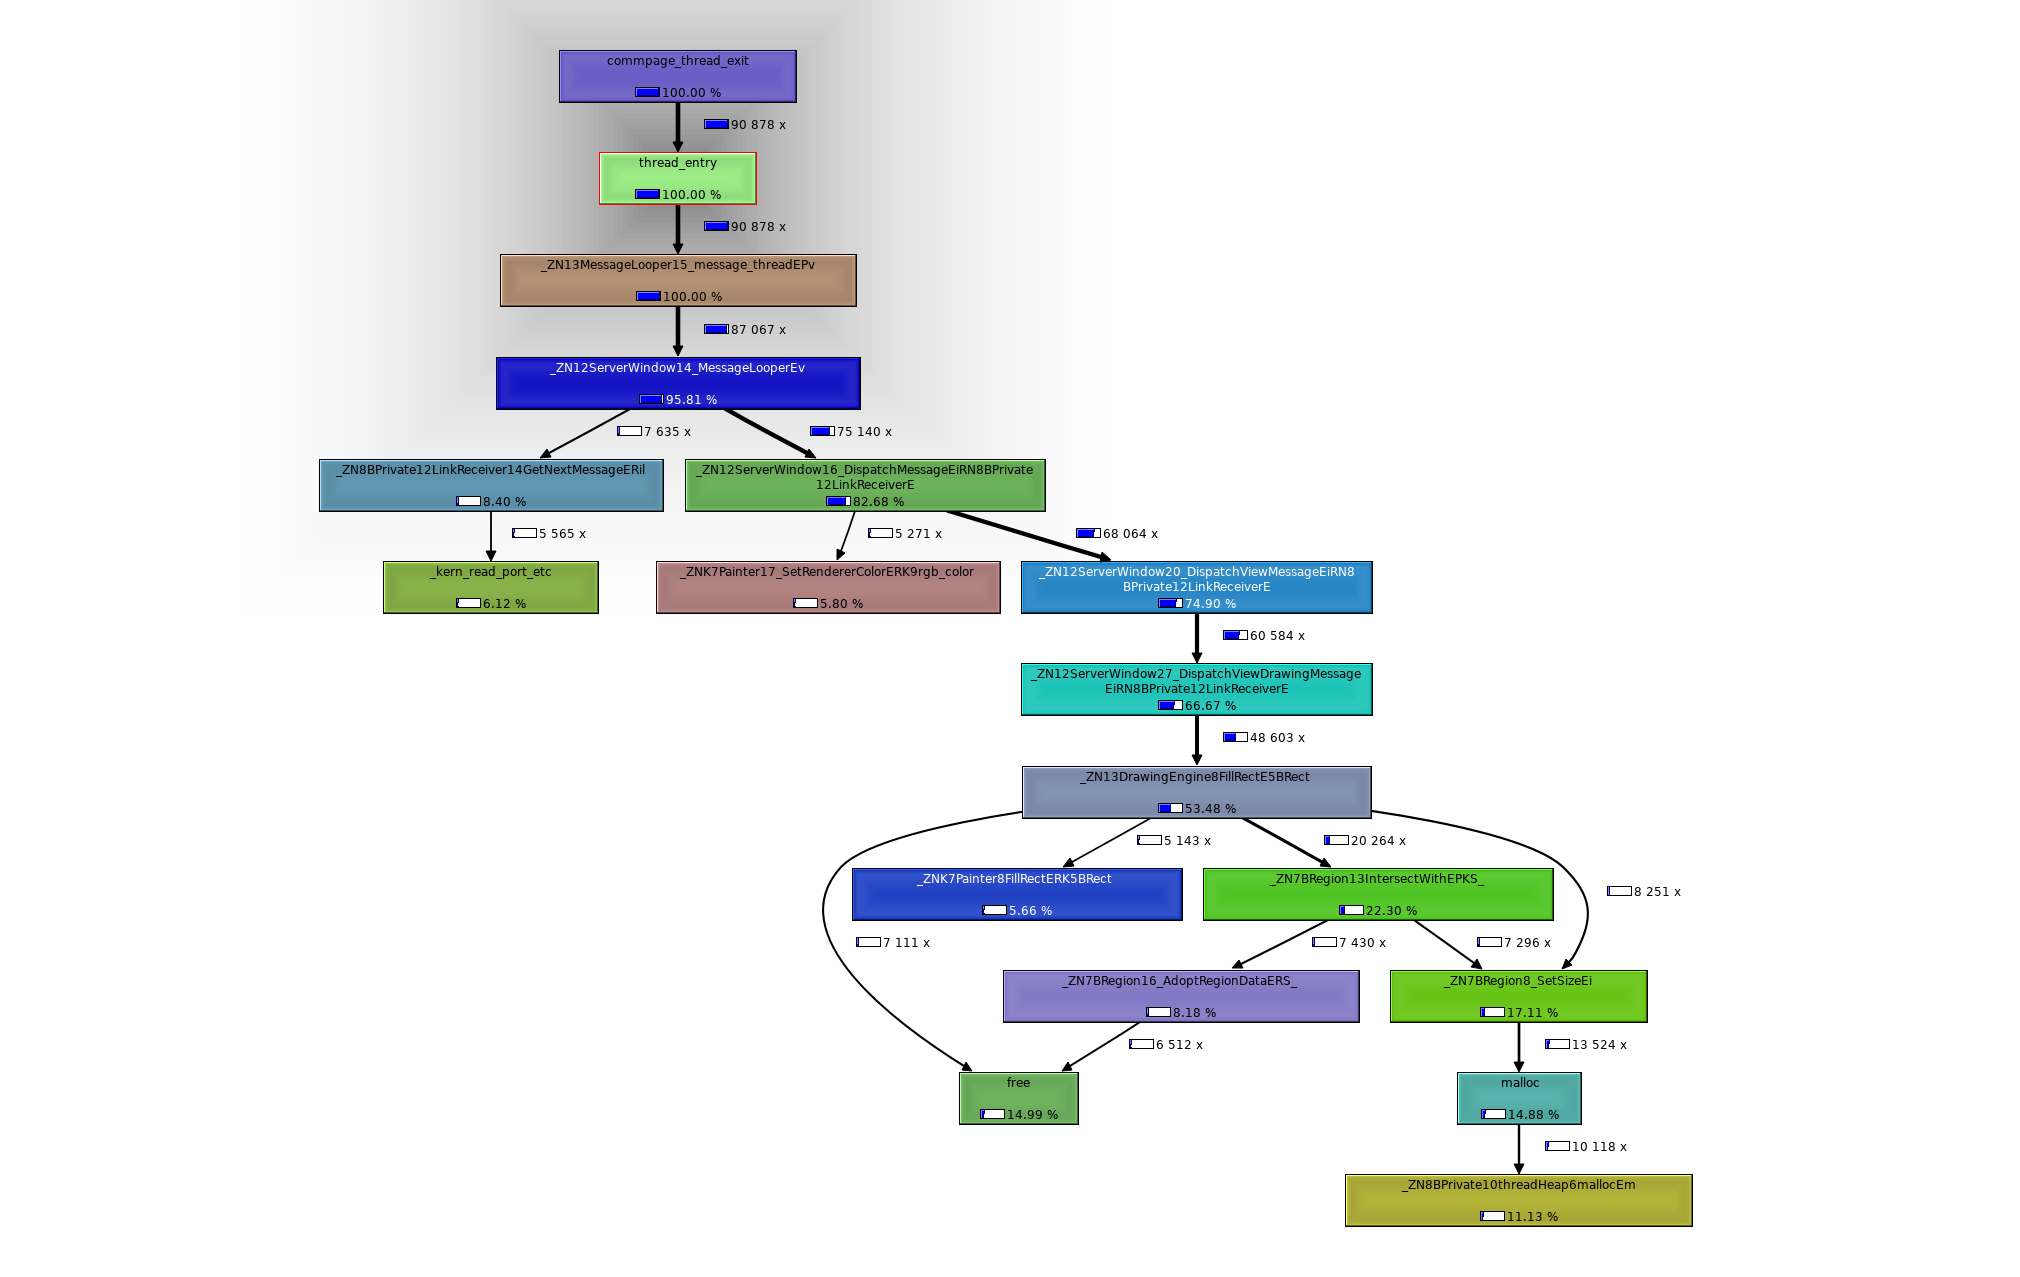
DrawingEngine::FillRect seems inefficient and call malloc/free on each call.
by , 22 months ago
| Attachment: | callgrind2.png added |
|---|
comment:40 by , 22 months ago
It seems there are significant overhead in heap memory allocator when creating and destroying windows:
profiling results for summary "all" (1):
  tick interval:  1000 us
  total ticks:    140988 (140988000 us)
  unknown ticks:  0 (0 us,   0.00%)
  dropped ticks:  0 (0 us,   0.00%)

        hits     unknown    image
  ------------------------------------------------------------------------------
         852           0        5 /Haiku/data/packages/haiku2/generated.x86_64.native/tests/libbe_test/x86_64/apps/lib/libtestappserver.so
          34           0       10 /boot/system/lib/libfreetype.so.6.18.3
           2           0        3 /boot/system/runtime_loader
           8           0        8 /Haiku/data/packages/haiku2/generated.x86_64.native/tests/libbe_test/x86_64/apps/lib/libhwinterfaceimpl.so
          63           0       21 /boot/system/lib/libbe.so
      134642           0       12 /boot/system/lib/libroot.so
          17           0       11 /boot/system/lib/libstdc++.so.6.0.29
        4914           0        6 /Haiku/data/packages/haiku2/generated.x86_64.native/tests/libbe_test/x86_64/apps/lib/libbe_test.so
           1           0       27 /boot/system/lib/libcrypto.so.1.1
          21           0       22 /boot/home/Tests/VideoStreams/build.x86_64/install/lib/libvideostreams.so
           4           0        7 /Haiku/data/packages/haiku2/generated.x86_64.native/tests/libbe_test/x86_64/apps/lib/libhwinterface.so

        hits       in us    in %   image  function
  ------------------------------------------------------------------------------
       65970    65970000   46.79      12  BPrivate::hoardSbrk(long)
       64626    64626000   45.84      12  BPrivate::hoardUnsbrk(void*, long)
        1790     1790000    1.27       6  BRegion::Support::miRegionOp(BRegion*, BRegion const*, BRegion const*, int (*)(BRegion*, clipping_rect*, clipping_rect*, clipping_rect*, clipping_rect*, int, int), int (*)(BRegion*, clipping_rect*, clipping_rect*, int, int), int (*)(BRegion*, clipping_rect*, clipping_rect*, int, int))
        1074     1074000    0.76       6  BRegion::Support::miUnionNonO(BRegion*, clipping_rect*, clipping_rect*, int, int)
         648      648000    0.46      12  __mutex_lock
         605      605000    0.43       6  BRegion::Support::miCoalesce(BRegion*, int, int)
         465      465000    0.33      12  _kern_mutex_lock
         446      446000    0.32       6  BRegion::Support::miSetExtents(BRegion*)
         414      414000    0.29      12  __mutex_unlock
         359      359000    0.25      12  _kern_mutex_unlock
         259      259000    0.18       6  BRegion::Support::miIntersectO(BRegion*, clipping_rect*, clipping_rect*, clipping_rect*, clipping_rect*, int, int)
         225      225000    0.16       6  BRegion::Support::miSubtractO(BRegion*, clipping_rect*, clipping_rect*, clipping_rect*, clipping_rect*, int, int)
         208      208000    0.15      12  BPrivate::hoardHeap::findAvailableSuperblock(int, BPrivate::block*&, BPrivate::processHeap*)
         163      163000    0.12      12  BPrivate::threadHeap::malloc(unsigned long)
         154      154000    0.11      12  memcpy
         149      149000    0.11      12  free
         130      130000    0.09      12  _kern_write_port_etc
         111      111000    0.08      12  BPrivate::processHeap::free(void*)
         107      107000    0.08      12  malloc
i find interesting this topic. Can you think a way, that i could help?