

#10279 closed bug (fixed)
random binary crashes, generally while compiling or doing other port work
| Reported by: | kallisti5 | Owned by: | nobody |
|---|---|---|---|
| Priority: | critical | Milestone: | R1/beta2 |
| Component: | System/Kernel | Version: | R1/Development |
| Keywords: | vm | Cc: | ttcoder |
| Blocked By: | Blocking: | #12796 | |
| Platform: | All |
Description (last modified by )
I've been seeing random application crashes from things that generally don't crash. (sh, python, etc)
I don't think these are isolated issues as in the case of each crash, if I run the task again it generally works. I've been collecting these debug reports and are attaching them to this case.
All of the crashes seem to be memory related in some way... and i've seen the crashes across multiple installations of Haiku.
System:
x86_gcc2
hrev46452, hrev46472 and earlier revs.
AMD Bulldozer, 8 core, 16GB ram.
Seen on:
AMD FX-8320 - kallisti5
AMD FX-8350 - SeanCollins
Attachments (49)
Change History (152)
by , 11 years ago
| Attachment: | bash-71019-debug-01-12-2013-02-53-55.report added |
|---|
by , 11 years ago
| Attachment: | cpp0-136338-debug-03-12-2013-18-14-34.report added |
|---|
by , 11 years ago
| Attachment: | python2.6-9561-debug-04-12-2013-17-01-39.report added |
|---|
follow-up: 2 comment:1 by , 11 years ago
| Keywords: | vm added; random crash removed |
|---|
follow-up: 3 comment:2 by , 11 years ago
Replying to bonefish:
Can't say anything wrt. the python debug report as it doesn't contain a disassembly (probably omitted due to the availability of debug info :-/).
That can be changed if desired; the assumption was simply that knowing what line of source the crash occurred at + the current state of the frame variables rendered including the disassembly/frame dump redundant.
follow-up: 4 comment:3 by , 11 years ago
Replying to anevilyak:
That can be changed if desired; the assumption was simply that knowing what line of source the crash occurred at + the current state of the frame variables rendered including the disassembly/frame dump redundant.
The disassembly/frame data can be useful also when debug info is available -- particularly when the source code might not be at hand or the issues isn't actually related to the program (like in this ticket). The source file and line number are missing in the debug report as well, BTW.
comment:4 by , 11 years ago
Replying to bonefish:
The disassembly/frame data can be useful also when debug info is available -- particularly when the source code might not be at hand or the issues isn't actually related to the program (like in this ticket). The source file and line number are missing in the debug report as well, BTW.
So they are, thought I'd implemented that but seemingly not. Added to TODO list in any case.
by , 11 years ago
| Attachment: | make-162787-debug-01-12-2013-23-57-13.report added |
|---|
debug report for make crash (gcc 4)
by , 11 years ago
| Attachment: | python2.6-26838-debug-09-12-2013-02-05-51.report added |
|---|
python, gcc2h hrev46510
by , 11 years ago
| Attachment: | python2.6-69264-debug-09-12-2013-04-50-35.report added |
|---|
python, gcc2h hrev46511
by , 11 years ago
| Attachment: | cpp0-98369-debug-09-12-2013-05-08-56.report added |
|---|
cpp0, gcc2h hrev46511
comment:5 by , 11 years ago
doesn't seem PAE related. I set the 4GB limit in the loader, same crashing issues.
comment:6 by , 11 years ago
With the introduction of NX support PAE is always used when available. So that option no longer disables PAE, I'm afraid.
follow-up: 8 comment:7 by , 11 years ago
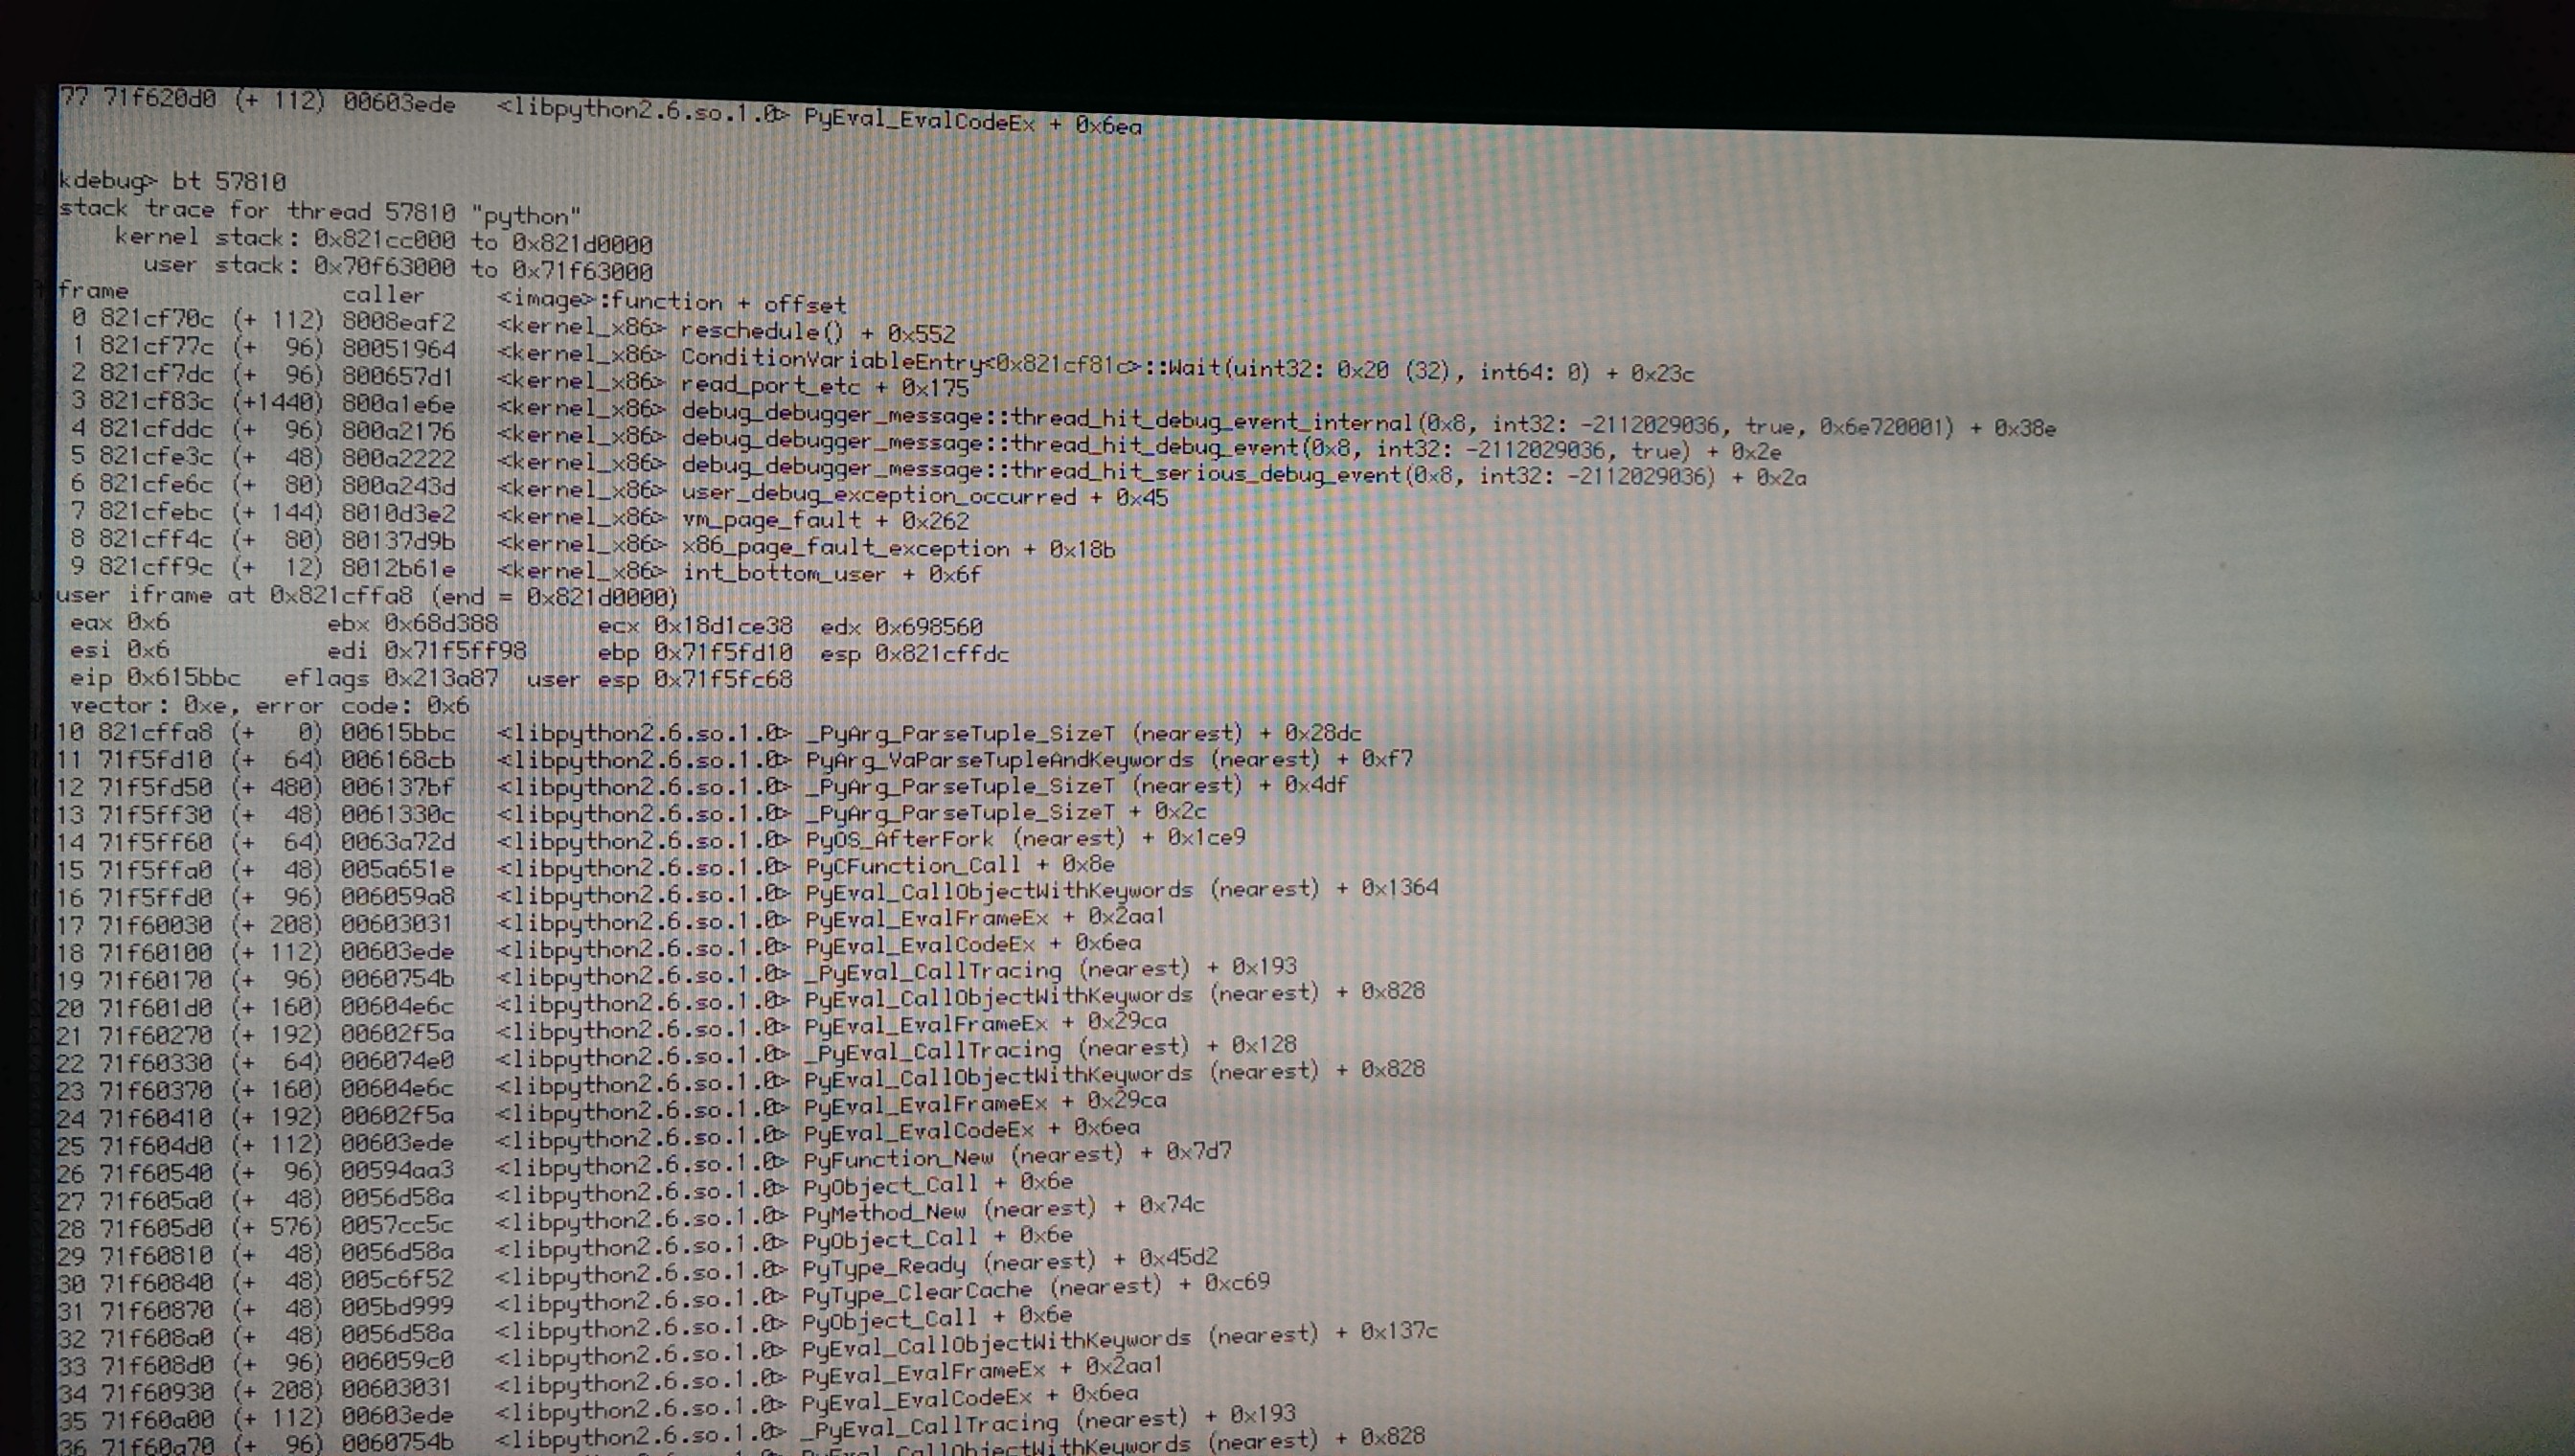
The first of the recent python debug reports shows a segment violation while executing the instruction mov %esp, %ebp, which is obviously not possible. Might be a Debugger/debugging API glitch or there's actually something else going on. A kernel stack trace for the crashing thread would be helpful and a mapping <address> <team> for the fault address.
follow-up: 10 comment:8 by , 11 years ago
Replying to bonefish:
With the introduction of NX support PAE is always used when available. So that option no longer disables PAE, I'm afraid.
Oh, that sucks. Any way it could be fixed? Otherwise, we should remove the loader option or comment it out.
Replying to bonefish:
The first of the recent python debug reports shows a segment violation while executing the instruction
mov %esp, %ebp, which is obviously not possible. Might be a Debugger/debugging API glitch or there's actually something else going on. A kernel stack trace for the crashing thread would be helpful and amapping <address> <team>for the fault address.
Will do, I've even seen the app_server crashing recently. So after the program crashes I should enter KDL land and do a backtrace?
comment:9 by , 11 years ago
| Milestone: | Unscheduled → R1/beta1 |
|---|---|
| Priority: | normal → high |
comment:10 by , 11 years ago
Replying to kallisti5:
Oh, that sucks. Any way it could be fixed? Otherwise, we should remove the loader option or comment it out.
It can certainly be fixed. Since PAE is machine specific and postdates our oldest target CPU (Pentium), there's a check somewhere that cause either PAE paging or 32 bit paging to be used. The boot loader setting would just have to be propagated to that point.
Will do, I've even seen the app_server crashing recently. So after the program crashes I should enter KDL land and do a backtrace?
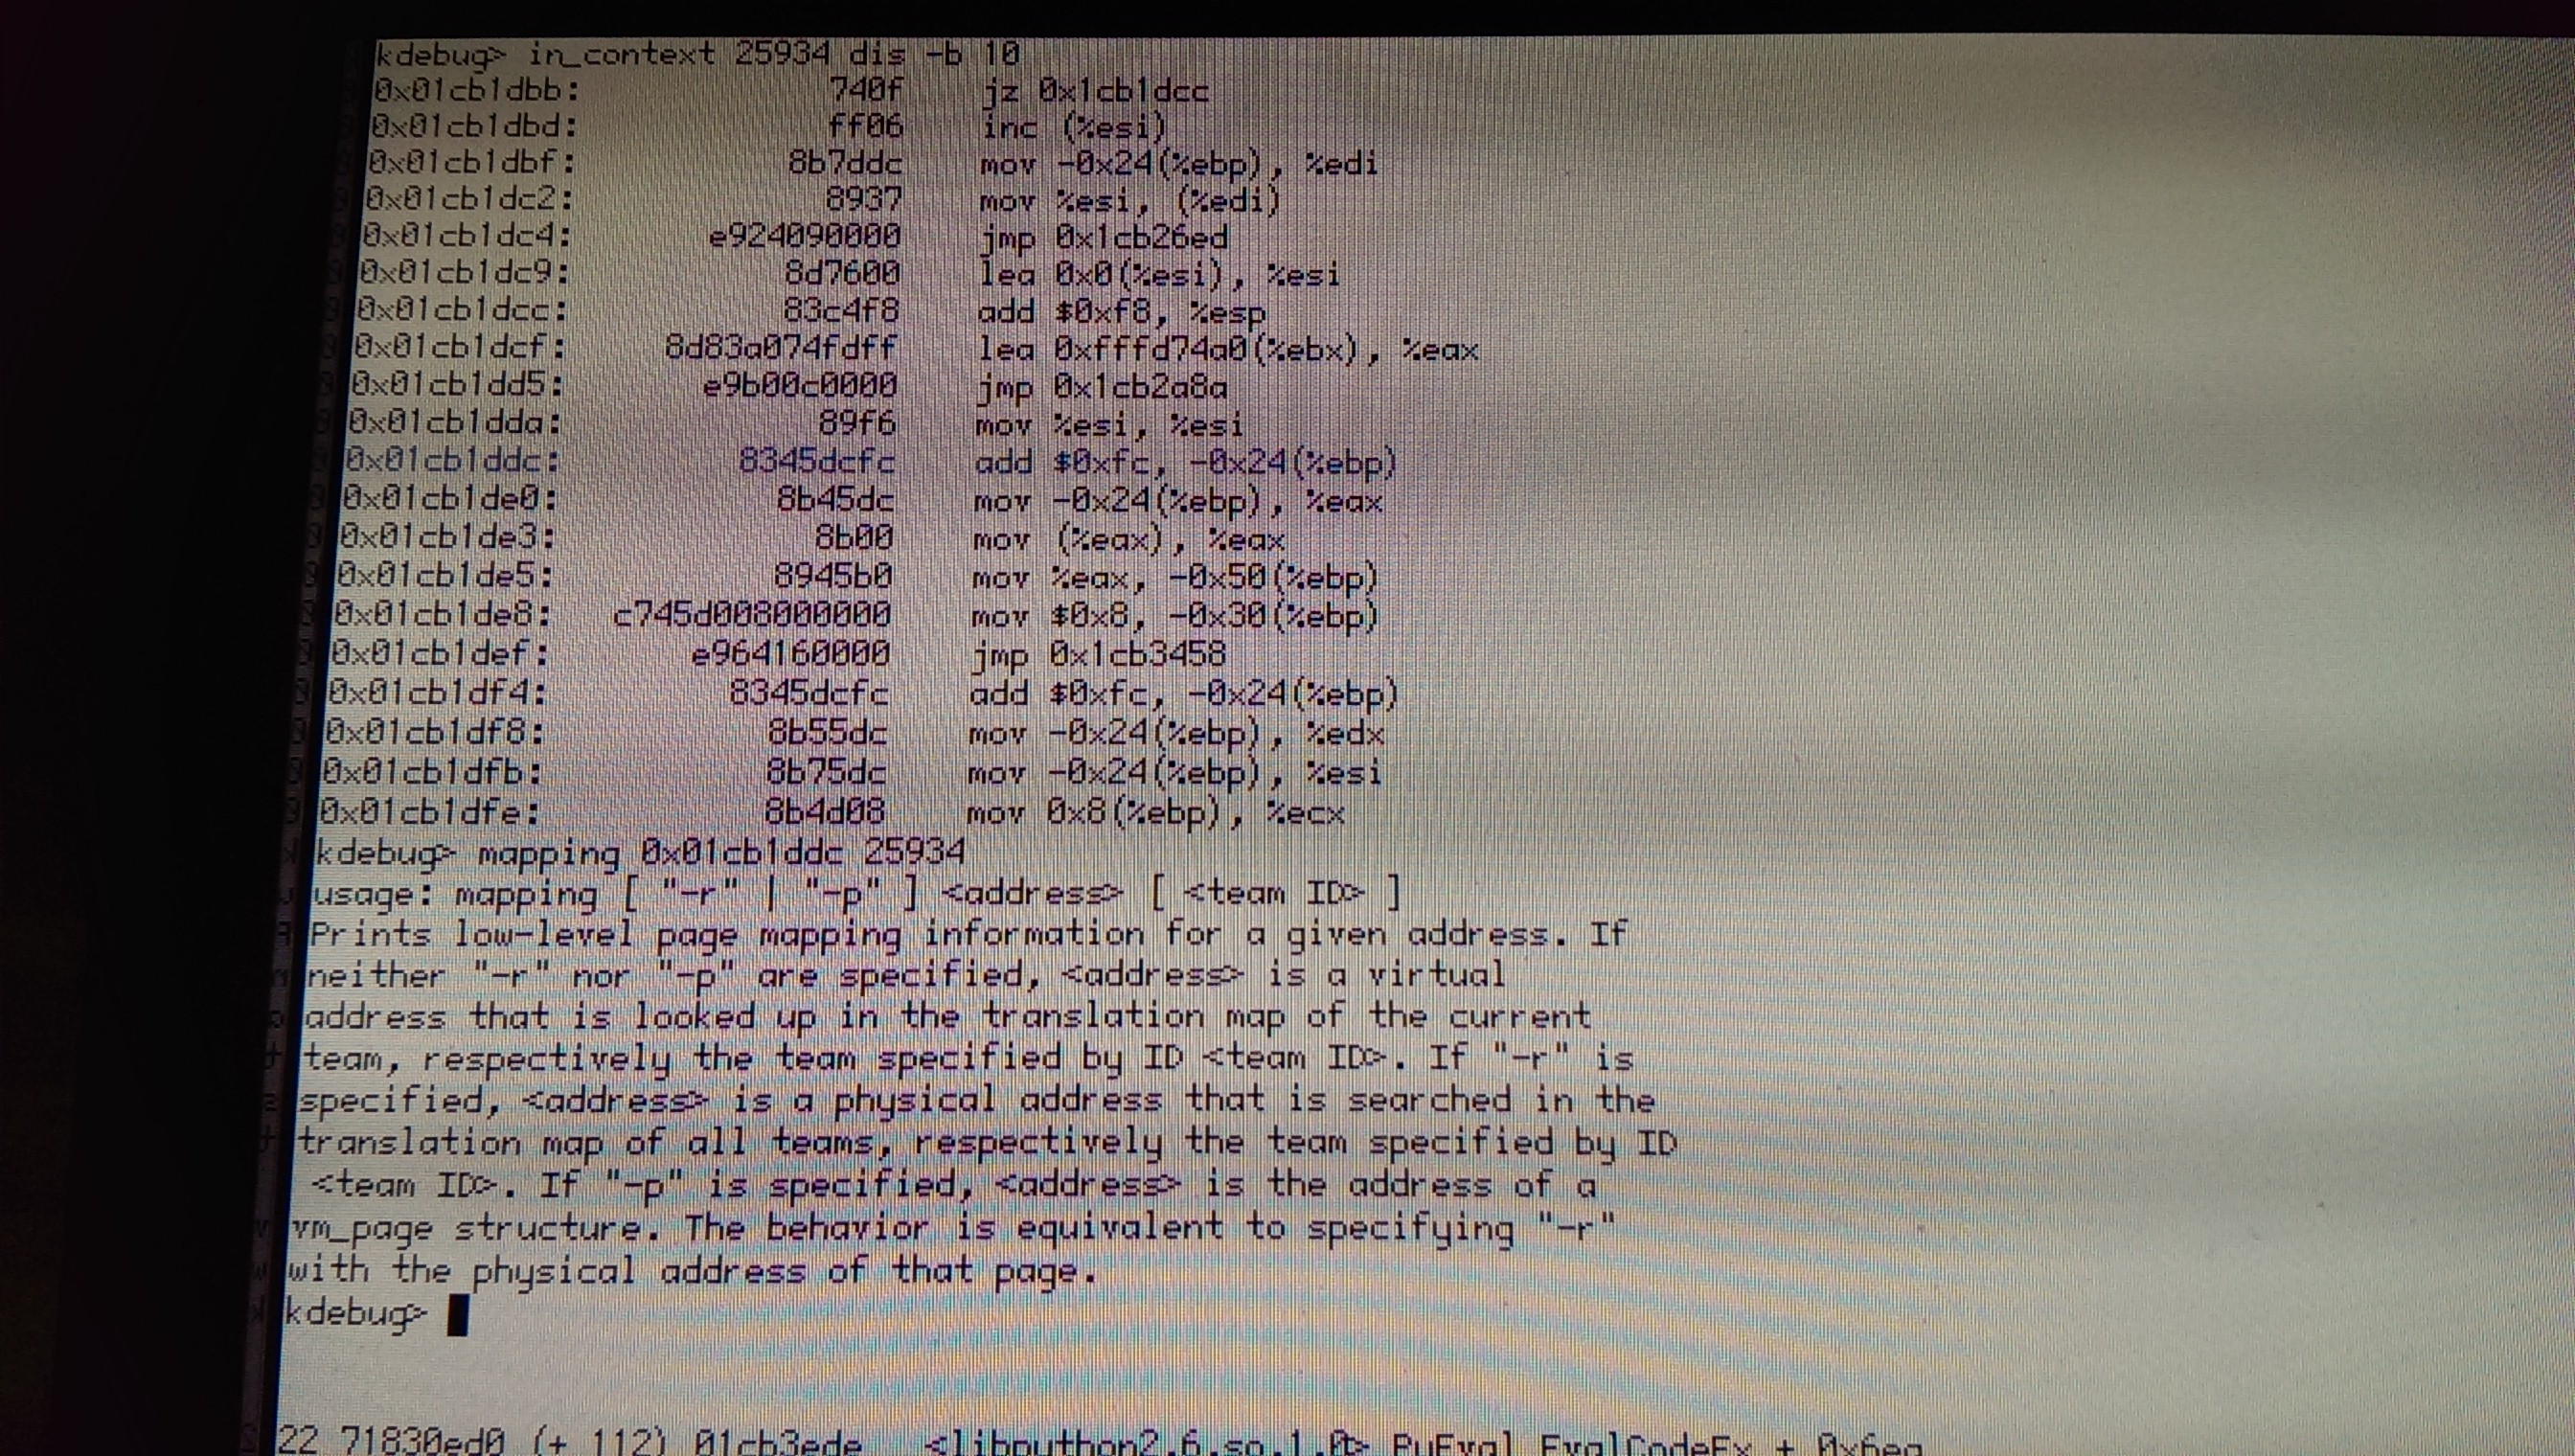
I would enter Debugger, save the debug log manually (via menu), store the thread ID in short-term memory, enter KDL, do a bt <thread ID>. Also nice: in_context <thread ID> dis -b 10 (gets a disassembly for the thread's current instruction pointer starting 10 instructions before) and, in case of the page fault, a mapping <address> <thread ID>. The page fault address can be found in the syslog or inferred from the thread's current instruction and the register state.
by , 11 years ago
| Attachment: | python2.6-57810-debug-10-12-2013-03-36-41.report added |
|---|
python test case 1 complete - report
by , 11 years ago
| Attachment: | python_kdl_incontext.jpg added |
|---|
python test case 1 complete - kdl in_context
by , 11 years ago
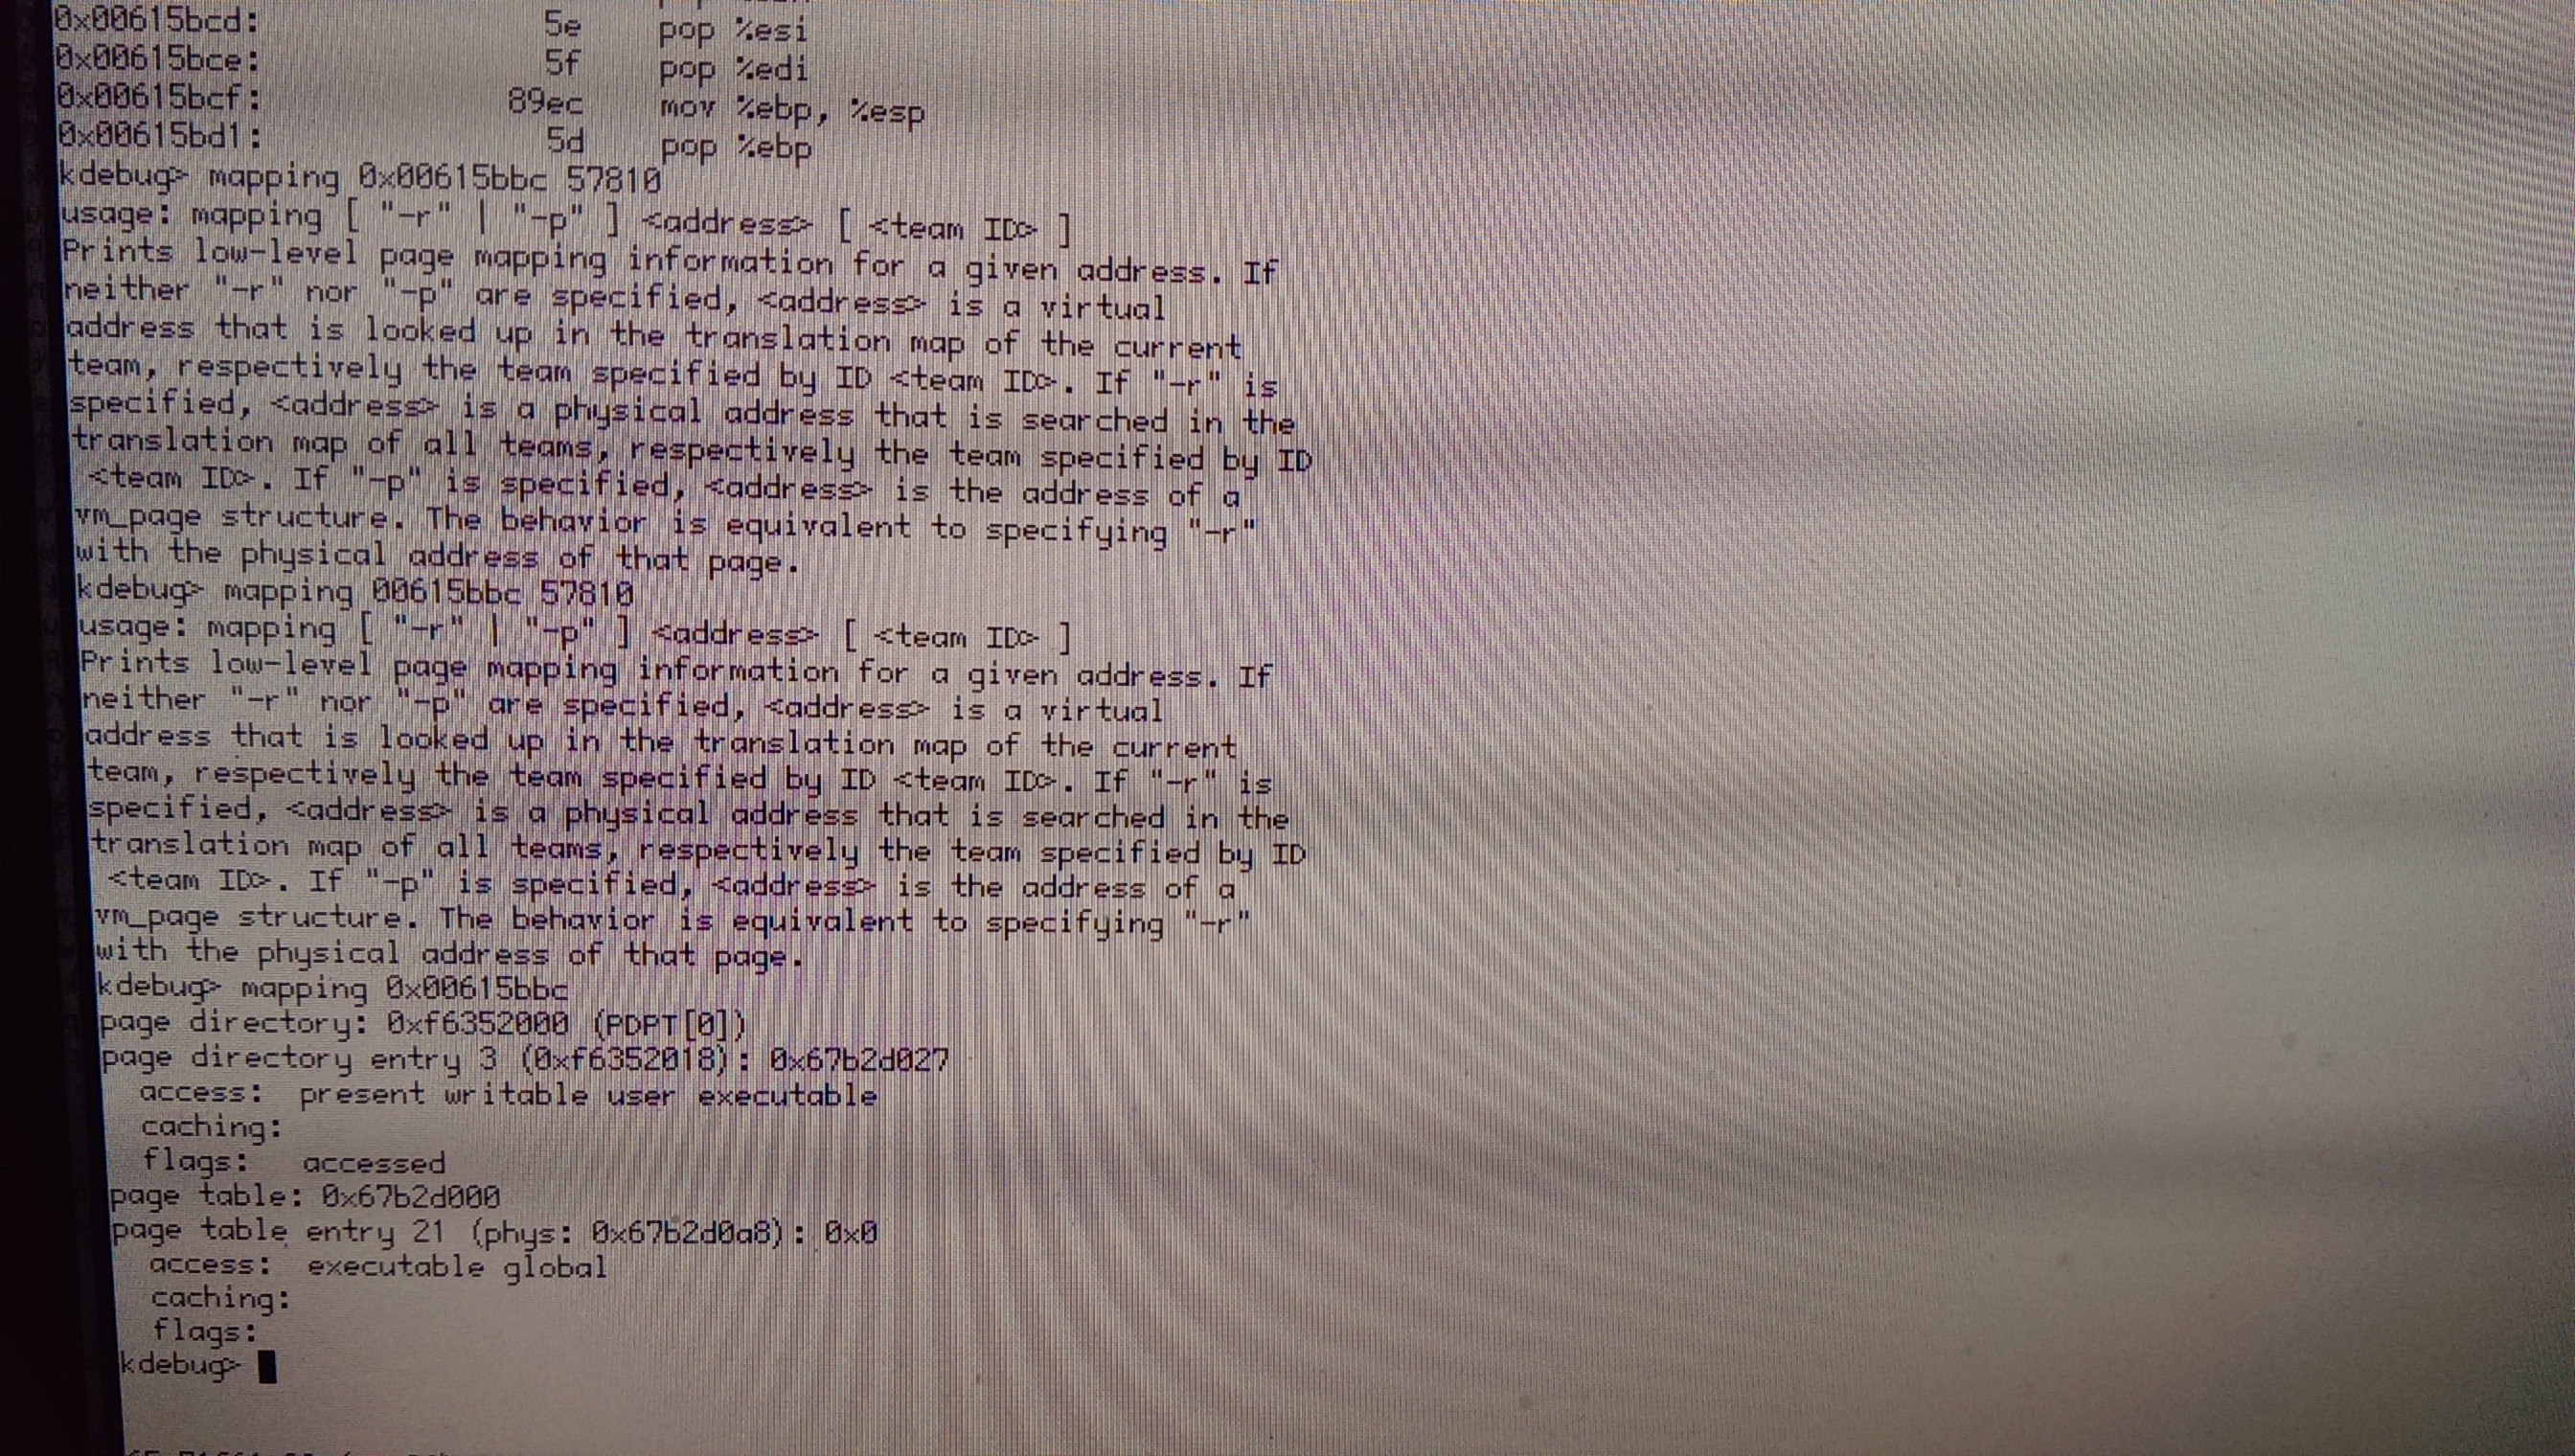
| Attachment: | python_kdl_mapping.jpg added |
|---|
python test case 1 complete - kdl mapping
comment:11 by , 11 years ago
Oh my, I messed up the mapping command. Fixed in hrev46518. I also made the 4GB limit safemode option disable PAE.
follow-up: 13 comment:12 by , 11 years ago
I disabled PAE, same crashes. mapping also seems still broken.
by , 11 years ago
| Attachment: | python2.6-25934-debug-11-12-2013-02-51-26.report added |
|---|
python test case 2 complete - report
by , 11 years ago
| Attachment: | python2_kdl_incontext.jpg added |
|---|
python test case 2 complete - kdl incontext
by , 11 years ago
| Attachment: | python2_kdl_mapping.jpg added |
|---|
python test case 2 complete - kdl mapping
follow-up: 14 comment:13 by , 11 years ago
Replying to kallisti5:
mapping also seems still broken.
Works fine here (retested with hrev46523, both gcc 2 and gcc 4 builds). Could something have gone wrong with the kernel or package rebuild?
BTW, mapping isn't fully implemented for 32 bit (i.e. non-PAE) paging. It does the argument checks, but simply prints nothing afterward.
BTW 2, when leaving KDL the session is, after a few seconds delay, written to the syslog. Filtering the syslog through the Terminal (cat + copy'n'paste) to get rid of the control and escape sequences would be appreciated.
comment:14 by , 11 years ago
Replying to bonefish:
Replying to kallisti5:
mapping also seems still broken.
Works fine here (retested with hrev46523, both gcc 2 and gcc 4 builds). Could something have gone wrong with the kernel or package rebuild?
Not sure, I did confirm in several places the new hrev as I saw the help text still looked like the old text.
Going to reboot, enter kdl and see if the help text for mapper is still the old team id vs thread id
BTW,
mappingisn't fully implemented for 32 bit (i.e. non-PAE) paging. It does the argument checks, but simply prints nothing afterward.
Will reboot to PAE.
BTW 2, when leaving KDL the session is, after a few seconds delay, written to the syslog. Filtering the syslog through the Terminal (
cat+ copy'n'paste) to get rid of the control and escape sequences would be appreciated.
haha, you're right. that would be a lot better vs screenshots :D I'm used to fatal KDL's and not triggered ones.
by , 11 years ago
| Attachment: | cc1-8547-debug-11-12-2013-04-21-36.report added |
|---|
cc1 test case 1 complete - report
comment:15 by , 11 years ago
edited cc_kdl_output.2.txt to remove control chars and clear up the commands I ran.
comment:16 by , 11 years ago
This example is unfortunately not so interesting. The crashing instruction is movsxb 0x2(%edx), %eax with edx being 0. This value came from the stack (-0x18(%ebp), i.e. an argument to the function) and indeed the stack is 0 at that address. I suppose something went wrong here, too, but at least it cannot directly be linked to the VM issue the other crashes indicate.
by , 11 years ago
| Attachment: | bash-1323-debug-12-12-2013-02-19-06.report added |
|---|
gcc test case 1 complete - report
by , 11 years ago
| Attachment: | Terminal-741-debug-12-12-2013-05-59-49.report added |
|---|
terminal - report
comment:17 by , 11 years ago
For the bash crash a mapping for the fault address (i.e. the one that was accessed) rather than (or in addition to) the address of the faulting instruction would have been interesting.
The info from the Terminal is a bit inconclusive. Debugger reads the following code from the executable:
0x01fe6ce4:               55  push %ebp
0x01fe6ce5:             89e5  mov %esp, %ebp <--
The kernel's disassembly shows:
0x01fe6ce6:             e583      in $0x83, %eax
0x01fe6ce8:               ec      in %dx, %al
The current instruction pointer is not aligned with the actual instruction (pointing to the second byte of the mov). It is also possible that the what is actually mapped is not the data from the executable. The overlap between the two disassemblies is only one (matching) byte, so that doesn't verify that possibility, but doesn't refute it either.
Debugger wasn't able to get a stack trace; the kernel shows BLooper::DispatchMessage() as the caller of the crashing TermView::_UpdateSIGWINCH(). The latter's frame wasn't set up yet, so its actual caller, TermView::MessageReceived(), would be missing from the stack trace. So that doesn't tell us anything either.
by , 11 years ago
| Attachment: | cpp0-5832-debug-16-12-2013-02-26-00.report added |
|---|
by , 11 years ago
| Attachment: | cpp0-kdl.txt added |
|---|
by , 11 years ago
| Attachment: | bash-52196-debug-16-12-2013-04-16-50.report added |
|---|
by , 11 years ago
| Attachment: | bash-kdl.txt added |
|---|
by , 11 years ago
| Attachment: | bash-7856-debug-16-12-2013-04-51-50.report added |
|---|
by , 11 years ago
| Attachment: | bash-7856-kdl.txt added |
|---|
comment:18 by , 11 years ago
I have noticed something interesting.. the following things generally crash while compiling:
- gcc
- cc0
- python
- sh / bash
- app_server
The app_server crashes are pretty fatal, so I haven't gotten much info from them.
comment:19 by , 11 years ago
just booted using the safe video mode to eliminate radeon_hd as a cause, still crashes.
At the moment running top from the command line seems to crash every time. EDIT: Nevermind about top, unrelated
Interesting side note, it seems like only things run from the command line crash.. i've never seen webpositive or any other applications crash in this way that aren't command line spawned.
follow-up: 21 comment:20 by , 11 years ago
In both of the latest three crashes an access to the stack caused the page fault. As written before, it would be good to get the mapping output for the fault address, not (only) for the IP. If you can't deduce the fault address from the disassembly, please look it up in the syslog before entering KDL -- there should be two "vm_page_fault:..." lines for the crash which both contain the fault address. Possibly rounded down to the page address, which doesn't matter, since mapping does the same.
by , 11 years ago
| Attachment: | bash-7459-debug-16-12-2013-21-15-21.report added |
|---|
bash - report - mapping of vm_page_fault
comment:21 by , 11 years ago
Replying to bonefish:
In both of the latest three crashes an access to the stack caused the page fault. As written before, it would be good to get the
mappingoutput for the fault address, not (only) for the IP. If you can't deduce the fault address from the disassembly, please look it up in the syslog before entering KDL -- there should be two "vm_page_fault:..." lines for the crash which both contain the fault address. Possibly rounded down to the page address, which doesn't matter, sincemappingdoes the same.
Ah, ok. I didn't pick that up before. Done and attached.
Thanks for looking at this! It's been driving me nuts :-)
comment:22 by , 11 years ago
0x15661ec was listed as the fault address? Given that the instruction was a push %ebp and the stack pointer was 0x72ce8ce4, I'd have expected 0x72ce8ce0 as the fault address.
comment:23 by , 11 years ago
| Cc: | added |
|---|
/me wonders if it's normal to have a NULL frame pointer as per the userland report:
Frame       IP          Function Name
-----------------------------------------------
00000000    0x1534b70   init_yy_io + 0
comment:24 by , 11 years ago
KERN: write access attempted on write-protected area 0x309c3 at 0x01566000
KERN: vm_page_fault: vm_soft_fault returned error 'Permission denied' on fault at 0x15661ec, ip 0x1534b70, write 1, user 1, thread 0x1d23
KERN: vm_page_fault: thread "sh" (7459) in team "sh" (7459) tried to write address 0x15661ec, ip 0x1534b70 ("bash_seg0ro" +0x26b70)
KERN: debug_server: Thread 7459 entered the debugger: Segment violation
comment:25 by , 11 years ago
as an fyi, I just did a memtest86+ round on the machine seeing this issue and no hardware errors were reported.
comment:26 by , 11 years ago
Mmh, curious. That means that the instruction that has actually been executed is not the one Debugger and later the kernel see. Please copy the dprintf() from http://cgit.haiku-os.org/haiku/tree/src/system/kernel/vm/vm.cpp#n4235 and insert a modified version farther below before the user_debug_exception_occurred() invocation at http://cgit.haiku-os.org/haiku/tree/src/system/kernel/vm/vm.cpp#n4308. In the new line the dprintf would be replaced by panic and it should look like || (panic(...), false) to work in the if condition.
This will cause the kernel to panic immediately when a userland team crashes, so we'll hopefully see what was actually executed. The information to retrieve would be the same: mapping for both fault address and IP (both in the panic message), dis -- for neither command the thread has to be specified anymore (i.e. omit the in_context <thread> before dis) -- and the debug report that can be captured after leaving KDL.
comment:27 by , 11 years ago
@bonefish Is the attached patch "good enough"? Tried to change everything you were looking for but got a little confused on the || (panic(...), false) bit as it seemed a little overly complex for what you were looking for.
Going to place image onto a usb disk, and try compiling something on the test machine to trigger.
by , 11 years ago
| Attachment: | vm-page-fault-diff added |
|---|
comment:28 by , 11 years ago
| patch: | 0 → 1 |
|---|
by , 11 years ago
| Attachment: | bash-14580-debug-17-12-2013-22-11-29.report added |
|---|
by , 11 years ago
| Attachment: | bash-7459-kdl.2.txt added |
|---|
by , 11 years ago
| Attachment: | bash-14580-kdl-special.txt added |
|---|
comment:29 by , 11 years ago
bash-14580-debug-17-12-2013-22-11-29.report and bash-14580-kdl-special.txt attached.
The addresses in the vm_page_fault were 0x0 (obviously an issue there), so i'm not sure the mapping address i picked was correct. so I went with "0x81fd3ea8" from kernel_debuggger_loop (not sure if that was a pointer to data, or the actual pointer to the fault address)
follow-up: 31 comment:30 by , 11 years ago
Your patch is OK in principle. It may, however, cause false positives. The first subconditions of the if check whether a SIGSEGV handler is installed for the team. Some programs (particularly programming language interpreters -- AFAIK OpenJDK, not sure about python) use those as a tool for their regular memory management (e.g. enlarging allocations lazily).
Reentering KDL after getting the debug report is not necessary (in case that was what you intended to attach -- "bash-7459-kdl.2.txt" seems to be old). In the first KDL session we get the information we need (and "fresher").
Omitting the in_context <thread> for the dis is somewhat important, though. We are already in the context of the thread anyway and we want to verify whether the CPU currently sees what it should see. The in_context resets the paging structures and may thus hide the problem.
We don't need a bt, as the panic already prints one. And finally, the mapping is needed for the two addresses printed in the panic message (the read or write address and the IP). Should it have been overwritten on screen by the stack trace, you can reprint the message via message. For a NULL pointer, as in this case, mapping is not needed.
comment:31 by , 11 years ago
Replying to bonefish:
Your patch is OK in principle. It may, however, cause false positives. The first subconditions of the
ifcheck whether a SIGSEGV handler is installed for the team. Some programs (particularly programming language interpreters -- AFAIK OpenJDK, not sure about python) use those as a tool for their regular memory management (e.g. enlarging allocations lazily).
Yeah, that was the one edge case I saw.. however definitely not something i'm going to commit or run for more than 10 minutes.
Reentering KDL after getting the debug report is not necessary (in case that was what you intended to attach -- "bash-7459-kdl.2.txt" seems to be old). In the first KDL session we get the information we need (and "fresher").
Sorry, ignore bash-7459-kdl.2.txt, that was an accidental upload.
Omitting the
in_context <thread>for thedisis somewhat important, though. We are already in the context of the thread anyway and we want to verify whether the CPU currently sees what it should see. Thein_contextresets the paging structures and may thus hide the problem.We don't need a
bt, as the panic already prints one. And finally, themappingis needed for the two addresses printed in the panic message (the read or write address and the IP). Should it have been overwritten on screen by the stack trace, you can reprint the message viamessage. For a NULL pointer, as in this case,mappingis not needed.
yeah, the bt was mostly to get the tid as it got cut off, next time i'll run message.
Going to do another test here in a few minutes and will hopefully have one more set of logs that will be more useful.
by , 11 years ago
| Attachment: | bash-24569-kdl.txt added |
|---|
by , 11 years ago
| Attachment: | bash-15133-kdl.txt added |
|---|
by , 11 years ago
| Attachment: | bash-6976-debug-18-12-2013-01-32-14.report added |
|---|
by , 11 years ago
| Attachment: | bash-6976-kdl.txt added |
|---|
comment:32 by , 11 years ago
I personally think bash-24569-kdl.txt is the most interesting as it had a solid memory address behind the page fault. I forgot to collect a report for 24569 and 15133, hopefully they are still useful.
by , 11 years ago
| Attachment: | sh-13815-kdl.txt added |
|---|
comment:34 by , 11 years ago
Thanks. Unfortunately that only verifies that the thread sees the correct code already at that point. It is obvious that either other code must have run or the register value were different, since the push %ebp cannot cause the page fault at 0x0 with esp being 0x71a35064. That the register value we see is incorrect is highly unlikely -- it is dumped on the kernel stack right when the page fault occurs.
That leaves the code. I don't think this is a problem at the paging level. At least I don't see how the thread runs the correct code, then one or more pages are mapped incorrectly, and immediately thereafter things look correct again. ATM the only explanation I can think of is that there's a race condition that can cause the thread to temporarily run in the wrong address space. Will think about how to verify that theory.
comment:35 by , 11 years ago
hmmmmmmmmm. I disabled all but one cpu core (the first one) in Pulse, 30 minutes of compiling and no crash :-\
comment:36 by , 11 years ago
I should mention that I don't have to do a parallel build or something to trigger these crashes. Each thread being spun up on a random core seems to be enough to trigger it. Once this build with a single core finishes, i'll bump it up to two cores to see if it still seems stable.
comment:37 by , 11 years ago
enabling as many as two cpus results in the crashes starting. With one cpu core enabled, haven't seen a crash yet after several extremely long builds. Definitely something with multiple cpus accessing memory.
by , 11 years ago
| Attachment: | always-set-page-dir-on-context-switch.diff added |
|---|
comment:38 by , 11 years ago
Alex, could you try the attached patch. It removes an optimization, trying (at least partially) to verify my latest theory.
comment:39 by , 11 years ago
no change it seems. building ncurses crashed just as quickly. Attaching a kdl + report incase it helps from the image modified with changes above.
by , 11 years ago
| Attachment: | bash-6630-debug-25-12-2013-03-13-53.report added |
|---|
by , 11 years ago
| Attachment: | bash-6630-kdl.txt added |
|---|
comment:40 by , 11 years ago
Any way to test this in VirtualBox? I've been running Haiku in a 2-core 1.5GB VM, no crashes. If I increase memory to 4097MB do the crashes start?
comment:41 by , 11 years ago
I see the same behavior as kallisti 5, Is this on AMD or intel hardware ?
follow-up: 45 comment:43 by , 11 years ago
Intel Core i7-860 16 GB RAM: So far I've only seen two crashes that might be related, and only after quite some time and memory turnover. So the issue may not be machine specific but it's obviously a lot easier to reproduce on some machines.
It looks like a race condition on multi-CPU hardware. It would be interesting to see whether Pawel's scheduler branch fixes it. He has changed quite a bit of low-level locking.
comment:44 by , 11 years ago
Replying to kallisti5:
AMD bulldozer here. 8 cores, 16 GB ram.
Same here, and if it means anything, I find this bug far far harder to induce on Intel hardware. I wonder if there is a memory controller or cache difference that could explain this behavoir ? Thinking back, I never saw this issue as much on the phenomII hardware, as soon as I upgraded to 8350 I started having trouble.
comment:45 by , 11 years ago
Replying to bonefish:
It looks like a race condition on multi-CPU hardware. It would be interesting to see whether Pawel's scheduler branch fixes it. He has changed quite a bit of low-level locking.
Yeah.. That test is next on my to do list unless Sean beats me to it :-)
comment:46 by , 11 years ago
nope, seems the scheduler branch currently doesn't compile:
Link /home/kallisti5/code/haiku-scheduler/generated.x86_gcc2/objects/haiku/x86_gcc2/release/system/libroot/libroot.so
/home/kallisti5/code/haiku-scheduler/generated.x86_gcc2/objects/haiku/x86_gcc2/release/system/libroot/libroot_init.o: In function `initialize_before':
libroot_init.c:(.text+0xe3): undefined reference to `get_system_info'
/home/kallisti5/code/haiku-scheduler/generated.x86_gcc2/objects/haiku/x86_gcc2/release/system/libroot/os/os_main.o: In function `_get_system_info':
(.text+0x4851): undefined reference to `get_cpu_topology_info'
/home/kallisti5/code/haiku-scheduler/generated.x86_gcc2/objects/haiku/x86_gcc2/release/system/libroot/os/os_main.o: In function `_get_system_info':
(.text+0x48a8): undefined reference to `get_cpu_topology_info'
/home/kallisti5/code/haiku-scheduler/generated.x86_gcc2/objects/haiku/x86_gcc2/release/system/libroot/posix/sys/posix_sys.o: In function `uname':
(.text+0x15b7): undefined reference to `get_system_info'
/home/kallisti5/code/haiku-scheduler/generated.x86_gcc2/objects/haiku/x86_gcc2/release/system/libroot/posix/sys/posix_sys.o: In function `uname':
(.text+0x165d): undefined reference to `get_cpu_topology_info'
/home/kallisti5/code/haiku-scheduler/generated.x86_gcc2/objects/haiku/x86_gcc2/release/system/libroot/posix/unistd/posix_unistd.o: In function `__sysconf':
(.text+0x4d3): undefined reference to `get_system_info'
/home/kallisti5/code/haiku-scheduler/generated.x86_gcc2/objects/haiku/x86_gcc2/release/system/libroot/posix/unistd/posix_unistd.o: In function `__sysconf':
(.text+0x505): undefined reference to `get_system_info'
/home/kallisti5/code/haiku-scheduler/generated.x86_gcc2/objects/haiku/x86_gcc2/release/system/libroot/posix/unistd/posix_unistd.o: In function `__sysconf':
(.text+0x55b): undefined reference to `get_system_info'
/home/kallisti5/code/haiku-scheduler/generated.x86_gcc2/objects/haiku/x86_gcc2/release/system/libroot/posix/unistd/posix_unistd.o: In function `__sysconf':
(.text+0x58b): undefined reference to `get_system_info'
/home/kallisti5/code/haiku-scheduler/generated.x86_gcc2/objects/haiku/x86_gcc2/release/system/libroot/posix/malloc/posix_malloc.o: In function `BPrivate::hoardHeap::initNumProcs(void)':
(.text+0x370e): undefined reference to `get_system_info'
collect2: ld returned 1 exit status
comment:47 by , 11 years ago
just an fyi... tried the scheduler branch after Pawel pointed out a needed cherry-pick. It actually makes things worse and crash easier :-\
follow-up: 50 comment:48 by , 11 years ago
That's a good thing, if that's also true on other hardware. The issue isn't really practical to debug, if it is as hard to reproduce as it is now.
comment:49 by , 11 years ago
as a side note, i've been testing this on gcc2h so far. Installed gcc4h on the machine this evening... same issue :-)
follow-up: 51 comment:50 by , 11 years ago
Replying to bonefish:
That's a good thing, if that's also true on other hardware. The issue isn't really practical to debug, if it is as hard to reproduce as it is now.
I think Kallisti5 should hit up his amd engineering cohort on the amd driver work, and see if they can send you a bulldozer cpu, becuase I can reproduce this easily. The glaring difference I see is intel vrs amd.
follow-up: 53 comment:51 by , 11 years ago
Replying to SeanCollins:
Replying to bonefish:
That's a good thing, if that's also true on other hardware. The issue isn't really practical to debug, if it is as hard to reproduce as it is now.
I think Kallisti5 should hit up his amd engineering cohort on the amd driver work, and see if they can send you a bulldozer cpu, becuase I can reproduce this easily. The glaring difference I see is intel vrs amd.
Haha, I don't want to abuse my connections. Honestly if buying bonefish a bulldozer cpu + motherboard is what it takes, I have no issues doing so :-) (or maybe a good use of Haiku funds?)
Sean, is yours an 8-core? Wonder how cheap of a CPU we could get away with that sees this issue.
by , 11 years ago
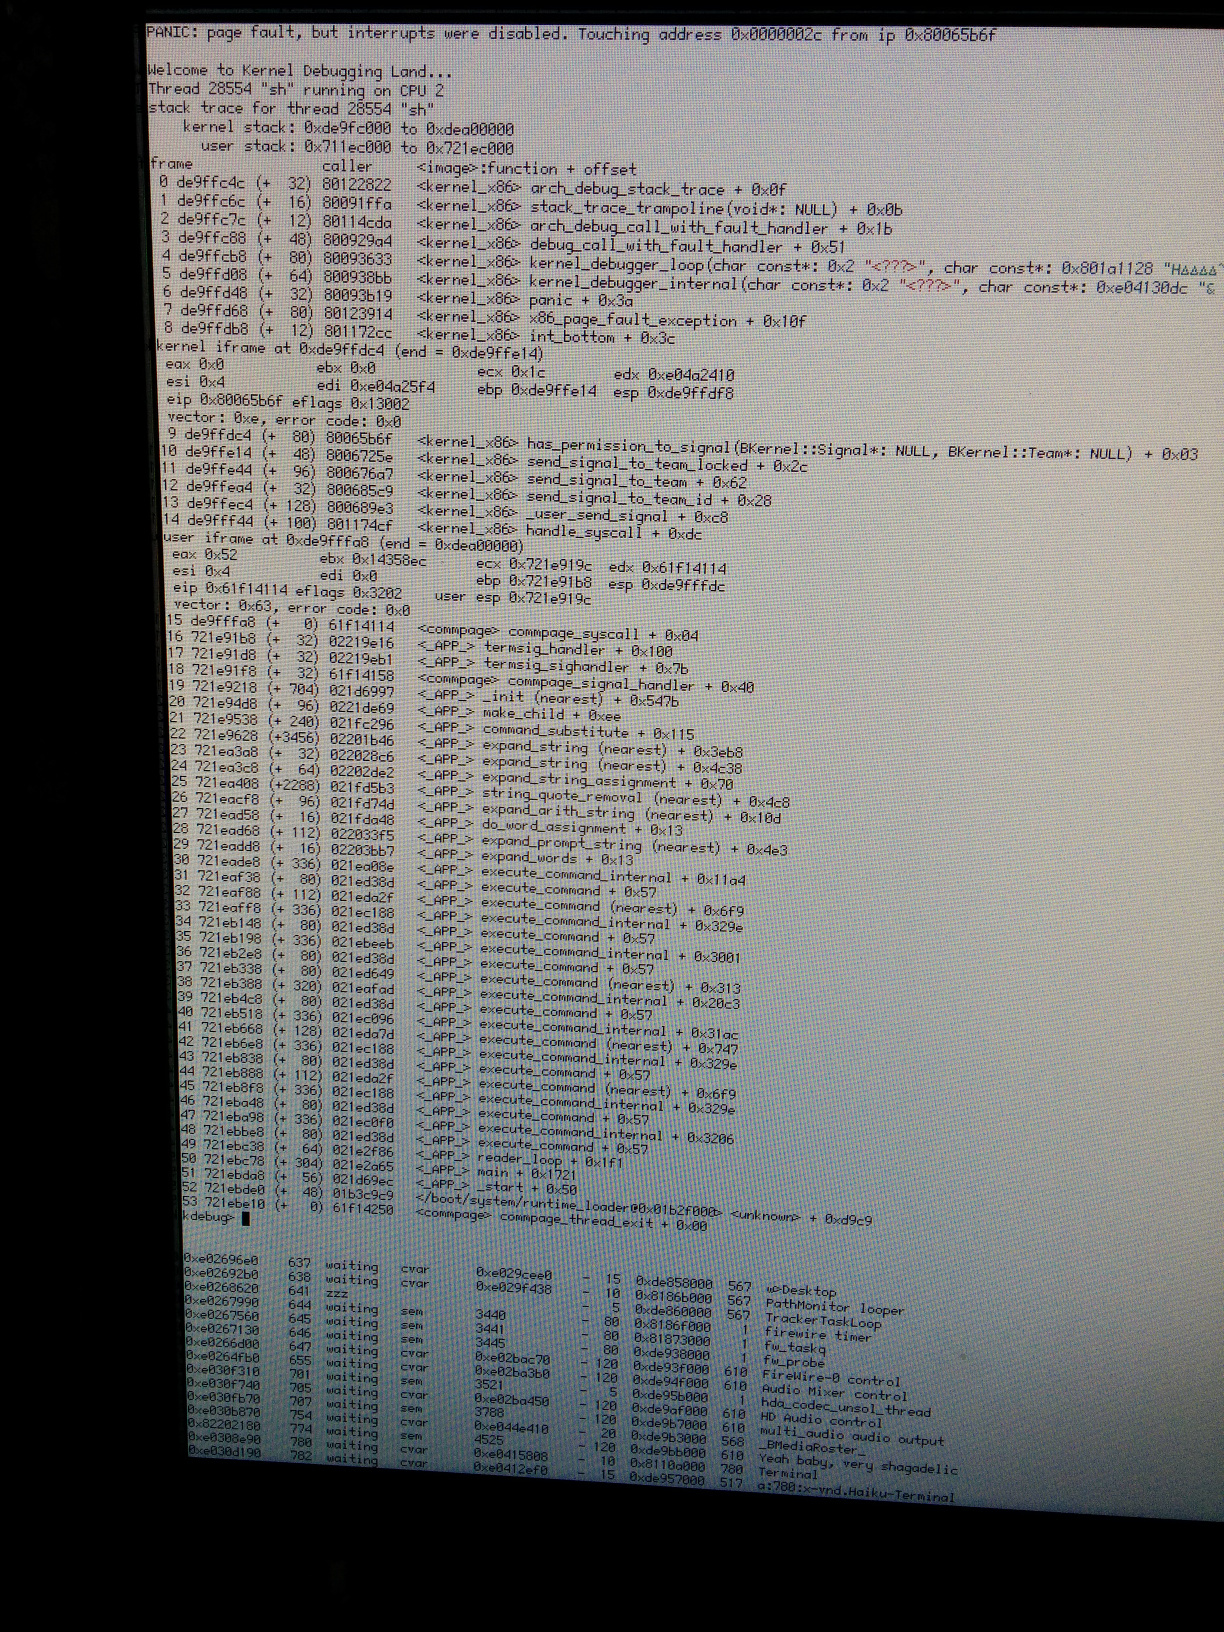
| Attachment: | IMG_20140118_103741.jpg added |
|---|
Not sure if this is related (if it isn't I can open a new bug) as of hrev46699 I get this kdl while compiling
comment:52 by , 11 years ago
Looks like ordinary NULL pointer dereferencing in the signal code. Since Pawel has touched that code, it's very likely that this is a new and unrelated issue. Please open a new ticket and assign it to him.
comment:53 by , 11 years ago
Replying to kallisti5:
Replying to SeanCollins:
I think Kallisti5 should hit up his amd engineering cohort on the amd driver work, and see if they can send you a bulldozer cpu, becuase I can reproduce this easily. The glaring difference I see is intel vrs amd.
Haha, I don't want to abuse my connections. Honestly if buying bonefish a bulldozer cpu + motherboard is what it takes, I have no issues doing so :-) (or maybe a good use of Haiku funds?)
FWIW, I wouldn't mind a temporary hardware loan for debugging the issue -- I can ship it back afterward as I don't really need it otherwise. Since I don't want to disassemble my main development machine and don't have all the parts to build another one, just a board and a CPU wouldn't help that much, though. If anyone has a laptop to spare for a while, that would be pretty perfect (one with a serial port would be divine, but I have no illusions :-)).
Other than that, it would be interesting whether the bug can also be reproduced in a virtual machine. That might allow for a remote debugging setup.
comment:54 by , 11 years ago
hm.. actually i've yet to see *this* crash after the scheduler merge. All i've seen so far is #10433
comment:55 by , 11 years ago
It might be fixed, but If the problem was in some way cache or TLB-related, it's possible that the new scheduler is simply hiding it by virtue of properly supporting affinity, as with the previous scheduler the thread would have constantly been core hopping, which is no longer the case. It would probably be worth analyzing it on a revision where it still occurs just to be sure, as if it is in fact still present, it might simply crop up in more subtle or harder to analyze ways now.
comment:56 by , 11 years ago
nope. Just occured. hrev46711 Tried to grab a report but the entire system locked (no kdl)
Triggered a kdl manually and looked at syslog:
vm_soft_fault: va 0x0 not covered by area in address space
vm_page_fault: vm_soft_fault returned `Bad address` on fault at 0x80, ip, 0x80, write 0, user 1, thread 0x61a8
vm_page_fault: thread "sh" (25000) in team "sh" (25000) tried to execute address 0x80, ip 0x80 ("???" +0x80)
I think the KDL while generating a report may be due to another scheduler bug.
comment:59 by , 11 years ago
| Description: | modified (diff) |
|---|
comment:60 by , 11 years ago
| Milestone: | R1/beta1 → R1/alpha5 |
|---|---|
| Priority: | high → critical |
as this affects all users of modern AMD hardware, i'm putting this on alpha5 for now. (if we can't fix it this one may be bumped to beta1)
comment:61 by , 10 years ago
Just saw this in a VM running kvm on an AMD system. (hrev47345, x86 gcc4h)
building ncurses with haikuporter
vm_page_fault: vm_soft_fault returned error 'Bad address' on fault at 0x70d35f2c, ip 0x179fa16, write 1, user 1, thread 0x6c71
vm_page_fault: thread "tic" (27761) in team "tic" (27761) tried to write address 0x70d35f2c, ip 0x179fa16 ("libroot.so_seg0ro" +0x71a16)
debug_server: Thread 27761 entered the debugger: Segment violation
stack trace, current PC 0x179fa16  _IO_vfprintf + 0xc:
  (0x70d38918)  0x178b346  vsprintf + 0x5d
  (0x70d389f8)  0x179ec7b  sprintf + 0x21
  (0x70d38a18)  0x275a120  _nc_read_entry + 0x30
  (0x70d38a68)  0x275e956  _nc_resolve_uses2 + 0x326
  (0x70d38ef8)  0x275a451  _nc_read_termcap_entry + 0x151
  (0x70d397b8)  0x275a259  _nc_read_entry + 0x169
  (0x70d39808)  0x275e956  _nc_resolve_uses2 + 0x326
  (0x70d39c98)  0x275a451  _nc_read_termcap_entry + 0x151
  (0x70d3a558)  0x275a259  _nc_read_entry + 0x169
  (0x70d3a5a8)  0x275e956  _nc_resolve_uses2 + 0x326
  (0x70d3aa38)  0x275a451  _nc_read_termcap_entry + 0x151
  (0x70d3b2f8)  0x275a259  _nc_read_entry + 0x169
  (0x70d3b348)  0x275e956  _nc_resolve_uses2 + 0x326
  (0x70d3b7d8)  0x275a451  _nc_read_termcap_entry + 0x151
  (0x70d3c098)  0x275a259  _nc_read_entry + 0x169
  (0x70d3c0e8)  0x275e956  _nc_resolve_uses2 + 0x326
  (0x70d3c578)  0x275a451  _nc_read_termcap_entry + 0x151
  (0x70d3ce38)  0x275a259  _nc_read_entry + 0x169
  (0x70d3ce88)  0x275e956  _nc_resolve_uses2 + 0x326
  (0x70d3d318)  0x275a451  _nc_read_termcap_entry + 0x151
  (0x70d3dbd8)  0x275a259  _nc_read_entry + 0x169
  (0x70d3dc28)  0x275e956  _nc_resolve_uses2 + 0x326
  (0x70d3e0b8)  0x275a451  _nc_read_termcap_entry + 0x151
  (0x70d3e978)  0x275a259  _nc_read_entry + 0x169
  (0x70d3e9c8)  0x275e956  _nc_resolve_uses2 + 0x326
  (0x70d3ee58)  0x275a451  _nc_read_termcap_entry + 0x151
  (0x70d3f718)  0x275a259  _nc_read_entry + 0x169
  (0x70d3f768)  0x275e956  _nc_resolve_uses2 + 0x326
  (0x70d3fbf8)  0x275a451  _nc_read_termcap_entry + 0x151
  (0x70d404b8)  0x275a259  _nc_read_entry + 0x169
  (0x70d40508)  0x275e956  _nc_resolve_uses2 + 0x326
  (0x70d40998)  0x275a451  _nc_read_termcap_entry + 0x151
  (0x70d41258)  0x275a259  _nc_read_entry + 0x169
  (0x70d412a8)  0x275e956  _nc_resolve_uses2 + 0x326
  (0x70d41738)  0x275a451  _nc_read_termcap_entry + 0x151
  (0x70d41ff8)  0x275a259  _nc_read_entry + 0x169
  (0x70d42048)  0x275e956  _nc_resolve_uses2 + 0x326
  (0x70d424d8)  0x275a451  _nc_read_termcap_entry + 0x151
  (0x70d42d98)  0x275a259  _nc_read_entry + 0x169
  (0x70d42de8)  0x275e956  _nc_resolve_uses2 + 0x326
  (0x70d43278)  0x275a451  _nc_read_termcap_entry + 0x151
  (0x70d43b38)  0x275a259  _nc_read_entry + 0x169
  (0x70d43b88)  0x275e956  _nc_resolve_uses2 + 0x326
  (0x70d44018)  0x275a451  _nc_read_termcap_entry + 0x151
  (0x70d448d8)  0x275a259  _nc_read_entry + 0x169
  (0x70d44928)  0x275e956  _nc_resolve_uses2 + 0x326
  (0x70d44db8)  0x275a451  _nc_read_termcap_entry + 0x151
  (0x70d45678)  0x275a259  _nc_read_entry + 0x169
  (0x70d456c8)  0x275e956  _nc_resolve_uses2 + 0x326
  (0x70d45b58)  0x275a451  _nc_read_termcap_entry + 0x151
follow-up: 63 comment:62 by , 10 years ago
From the original bug report description, I'm still seeing instances of this a LOT. I have a folder full of debug reports :) 29 so far. The highest majority affect bash, but I've had crashes in as, grep (might be unrelated), ld, media_addon_server, TextSearch, and Tracker.
Most are segment violations, some are invalid opcode exceptions, and in Tracker, general protection fault.
This is on hrev47582, with an i3-4010U CPU. I can upload the reports if you think they'd be useful. Hardly any of them crash in identical places...
comment:63 by , 10 years ago
Replying to jessicah:
From the original bug report description, I'm still seeing instances of this a LOT. I have a folder full of debug reports :) 29 so far. The highest majority affect bash, but I've had crashes in as, grep (might be unrelated), ld, media_addon_server, TextSearch, and Tracker.
I can crash grep quite easily, as using "-ir" to do a recursive, case-insensitive search crashes grep for me 100% of the time. Not sure if you are experiencing similar things, but figured I'd point that out. It might deserve its own ticket.
follow-up: 65 comment:64 by , 10 years ago
@jprostko I think that's a bug in grep. Using -i results in a crash on every run.
comment:65 by , 10 years ago
Replying to kallisti5:
@jprostko I think that's a bug in grep. Using -i results in a crash on every run.
Yeah, I kind of figured that. I guess that's a bug report for HaikuPorts then.
comment:66 by , 10 years ago
| Description: | modified (diff) |
|---|
There already is a bugreport for the grep -i issue: https://dev.haiku-os.org/ticket/9342
comment:67 by , 10 years ago
| Description: | modified (diff) |
|---|
For the record, I'm getting similar symptoms on my Core i3 machine. After a few hours of uptime and compilation of packages with haikuporter, I get random "invalid opcode exception" on the first push instruction of functions.
comment:68 by , 10 years ago
With the recent kernel fixes: @pulkomandy @kallisti5 have either of you seen this recently?
comment:69 by , 10 years ago
I've experienced a crash in bash still. But I don't know if it's the same type of crash.
by , 10 years ago
| Attachment: | bash-63838-debug-05-11-2014-06-10-19.report added |
|---|
bash crashing on hrev48222
comment:70 by , 10 years ago
Does not look similar, this is a "normal" crash (out of bounds access in strcpy - people are still using strcpy?) and probably an actual bug in bash.
I'll be watching for this next time I do some haikuporter work, which is usually a good way to trigger it here.
comment:71 by , 10 years ago
| Milestone: | R1/alpha5 → R1/beta1 |
|---|
by , 10 years ago
| Attachment: | Terminal-238260-debug-15-11-2014-02-02-58.report added |
|---|
Invalid opcode in Terminal, whilst running boost tests with -j4
comment:72 by , 10 years ago
With all the kernel fixes in the past 4mo, has anyone seen this recently?
comment:73 by , 10 years ago
I didn't meet this problem for some time. However, don't close this until someone with an AMD Bulldozer CPU has reported it's ok (I have only Intel machines here).
comment:74 by , 10 years ago
I attempted to run a recent x86_64 haiku on my 8-core bulldozer and had hard lockup issues. Might be unrelated... but it has prevented me from getting in the workload to try and reproduce this one.
As soon as I have some free-time i'll hook up a serial cable to my main desktop and see if I can document / solve the hard lockup issue.
comment:75 by , 9 years ago
I've just had a definitive experience of this again. I've had invalid opcode type debug reports all the time still, but this one is clearly something going awry.
attachment:Vision-369516-debug-06-06-2015-23-34-50.report attachment:bash-873030-debug-07-06-2015-01-38-12.report attachment:syslog
Granted, I was running a boost regression testsuite, a texlive package build, and a libqt4 package build concurrently... :p
On hrev49248, x86_gcc2 hybrid. Intel i5-3570K w/8GB RAM.
by , 9 years ago
| Attachment: | Vision-369516-debug-06-06-2015-23-34-50.report added |
|---|
by , 9 years ago
| Attachment: | bash-873030-debug-07-06-2015-01-38-12.report added |
|---|
And also bash from same session
comment:76 by , 9 years ago
Bah. We really can't have things crashing under heavy workloads (esp if we start automating recipe builds)
Do we want to call this one a blocker to R1 beta 1?
comment:77 by , 9 years ago
Is this still a problem? Things are now very stable for me (I'be been building webkit for the whole day, and did quite a lot of stuff during the coding sprint too) without ever hitting a crash; but I'm on intel hardware.
comment:78 by , 9 years ago
I actually haven't seen this for some time on an i5 x86_64 compiling things like LLVM. jessicah mentioned still seeing it, but maybe she's seeing another issue?
comment:79 by , 9 years ago
Just realized that this is a bug against AMD and not Intel. I'll confirm this evening if it is still happening.
comment:80 by , 9 years ago
I am attempting to reproduce, so far so good with a lot of system stress and compiling going on in the background. will report back in a few days. Looks fixed so far. the good news is that I have not changed ANY of the hardware in my machine since I first commented nearly 3 years ago. so I should have one of the better test cases.
comment:81 by , 9 years ago
I haven't been able to reproduce this bug and I use to be able to hit it ALL the TIME. It is very likely that some of the memory fixes and scheduler work may have fixed this for me.
AMD 8350 cpu
comment:82 by , 8 years ago
I've changed mainboards (same cpu tho). This issue has gone away but an even worse #12671 has popped up (990FX chipset)
I think it's safe to call this one resolved?
comment:83 by , 8 years ago
I still get spurious crashes now and then; although my system is Intel. Just haven't uploaded any of my debug reports in a while. Suppose I should do that... maybe the new core dump feature might be useful if it happens for me again :)
comment:84 by , 8 years ago
| patch: | 1 → 0 |
|---|
comment:86 by , 8 years ago
| Owner: | changed from to |
|---|---|
| Status: | new → assigned |
So any status update here? Otherwise we could close it.
comment:87 by , 8 years ago
| Blocking: | 12796 added |
|---|
comment:88 by , 7 years ago
| Milestone: | R1/beta1 → Unscheduled |
|---|
Nobody seems to have seen this in some time; removing from b1.
comment:89 by , 7 years ago
Still seen every now and then, especially when making mass update with haikuporter: for instance four builders on 4 CPUs; the more chroots there are, the easier to reproduce.
comment:90 by , 7 years ago
There were a variety of potential races in team creation that should now be resolved in hrev51700, some of which involved pointers being initialized while other kernel threads already had access to the data structure.
I have no idea of the amount of (bad) luck it would take for such a race to collide with some other (legitimate and writable) chunk of accessed memory ... but given that I heard reports from users that the first change to that code possibly cleared up some other KDLs, perhaps it's somehow related.
comment:91 by , 7 years ago
I see sporadic crashes on a AMD FX-6100 six-core processor, when performing compilation of larger projects, mostly in bash (but only when using make -j 6, not in single core builds).
by , 7 years ago
| Attachment: | python2.7-988-debug-06-04-2018-10-21-30.report added |
|---|
follow-up: 93 comment:92 by , 7 years ago
The python crash happend during running haikuporter on a fresh initialized git repo. I then re-ran hp and it resumed just fine.
This happend to me quite often on bare metal using this AMD machine, but never inside VirtualBox.
follow-up: 95 comment:93 by , 7 years ago
Replying to Nikolas Zimmermann:
The python crash happend during running haikuporter on a fresh initialized git repo. I then re-ran hp and it resumed just fine.
You could try with 4gb_memory_limit (available in the bootloader).
comment:94 by , 7 years ago
Thanks @korli, unfortunately that didn't help. Same issue.
But it's very hard to track this issue for me at present, because my machine also reboots instantenous under heavy load, e.g. make -j 6 on my AMD 6-core system.
I setup debugging via COM port and captured the syslog on another machine, but unfortunately there were no valuable information at the time of reboot - syslog just looks fine, no hints in the right direction.
As my test machine was a spare one "from the attic", I now replaced main board, power, RAM, etc. but the problem persists - only the CPU stayed the same. I will install Arch Linux tomorrow, and see if I can reproduce the reboot under heavy load, maybe I'm facing bad hardware...
comment:95 by , 7 years ago
Replying to korli:
Replying to Nikolas Zimmermann:
The python crash happend during running haikuporter on a fresh initialized git repo. I then re-ran hp and it resumed just fine.
You could try with 4gb_memory_limit (available in the bootloader).
Regarding my random reboot problems, that make debugging so hard: By now, I also replaced the CPU, played around with all kind of BIOS settings (voltages, frequencies, etc.), and all combinations of the safe mode boot options.
The 4gb_memory_limit helps me! When using that option, I no longer experience the random reboots. The random binary crashes are still present under heavy load - but at least my machine doesn't reboot all ~10 minutes anymore!
Syslog entries from the crash runs: 2018-04-12 10:46:55 KERN: using PAE paging 2018-04-12 10:54:34 KERN: using PAE paging 2018-04-12 12:12:28 KERN: using PAE paging 2018-04-12 12:21:04 KERN: using PAE paging ...
Stable runs: 2018-04-12 12:26:09 KERN: using 32 bit paging (PAE not available) 2018-04-12 12:42:09 KERN: using 32 bit paging (PAE not available) 2018-04-12 13:01:41 KERN: using 32 bit paging (PAE not available) ..
comment:96 by , 7 years ago
| Blocked By: | 14082 added |
|---|
comment:98 by , 6 years ago
I just tried Beta 1 x86_64 on an FX-8350 system with 16GB RAM and got KDLs right from the live USB environment. The same USB stick boots and works (except for the usual lack of sound) on my other system.
comment:99 by , 6 years ago
KDLs are not random binary crashes, so, that is totally unrelated to this ticket.
comment:101 by , 6 years ago
| Cc: | added; removed |
|---|
comment:102 by , 6 years ago
| Blocked By: | 14082 removed |
|---|---|
| Resolution: | → fixed |
| Status: | assigned → closed |
Given that the remaining issues on Bulldozer now have their own ticket (and are triple faults, not random application crashes), I think this one can be closed, finally.
comment:103 by , 5 years ago
| Milestone: | Unscheduled → R1/beta2 |
|---|
Assign tickets with status=closed and resolution=fixed within the R1/beta2 development window to the R1/beta2 Milestone
The first two crashes (bash, cpp0) look quite similar. Both occur at the first instruction of a function, the one that pushes the old frame pointer on the stack. And in both cases the stack pointer looks like it refers to a valid address on the stack, so there shouldn't really be any cause for the crash. That points toward a VM issue.
Can't say anything wrt. the python debug report as it doesn't contain a disassembly (probably omitted due to the availability of debug info :-/).
FWIW, over the last days, since I've been using large RAM disks, I've seen two crashes myself. The first time it were actually simultaneous crashes of 8 make processes. The disassembly in the debug report suggests that the executed code has been replaced. Given that the code is 'mmap()'ed from the file, it's probably some mix-up of pages, i.e. most certainly a VM (or file cache) issue. Unfortunately I haven't kept the debug report of the second crash (bash).
The fact that I've seen two of those weird crashes in a few days, while I haven't seen anything like that for a long time, I suppose it has to do with my RAM disk use. I don't think the driver is to blame, though. It's really just a page consumer, so I consider it rather unlikely that it messes up other pages. It's probably more likely the fact that it causes quite a bit of memory use. Both crashes have been observed after quite a bit of run time and memory turnover.