

Opened 5 months ago
Last modified 4 months ago
#19075 new bug
[ActivityMonitor] CPU Speed graphs' odd behavior on Atom N450 and N2600 CPUs.
| Reported by: | bipolar | Owned by: | nobody |
|---|---|---|---|
| Priority: | normal | Milestone: | Unscheduled |
| Component: | System/Kernel | Version: | R1/beta5 |
| Keywords: | Cc: | ||
| Blocked By: | Blocking: | ||
| Platform: | All |
Description
This is on beta5 64 bits (variing revisions, up to "+90" now).
CPUs are:
- Atom N450: 1 core / 2 threads. 1.66 GHz (1.0, 1.33, and 1.66 GHz are the freq steps it can use on Win/Lin).
- Atom N2600: 2 cores / 4 threads. 1.6 GHz (usable freqs in Win/Linux: 600 MHz to 1.6 GHz, in 200 MHz steps).
(latter CPU is really unstable on Haiku, except for one day, where it mostly worked OK, sigh).
None of these CPUs has a working frequency scaling driver on Haiku, so one would expect their *reported* CPU frequencies to be pretty stable... yet:
Adding a CPU Speed graph in ActivityMonitor shows their value pretty stable, as expected (small fluctuations expected due to clock spread-spectrum and such).
Yet, if one then drops said graphics onto the Desktop as a replicant, then CPU Speed starts showing way lower values. At first I thought the N2600 somehow had magically gained the ability to do CPU freq scaling without a driver. It did not :-D).
What's more, while settings things up to capture a screenshot showing the difference between ActivityMonitor's "main app" vs "replicant", noticed something even more strange:
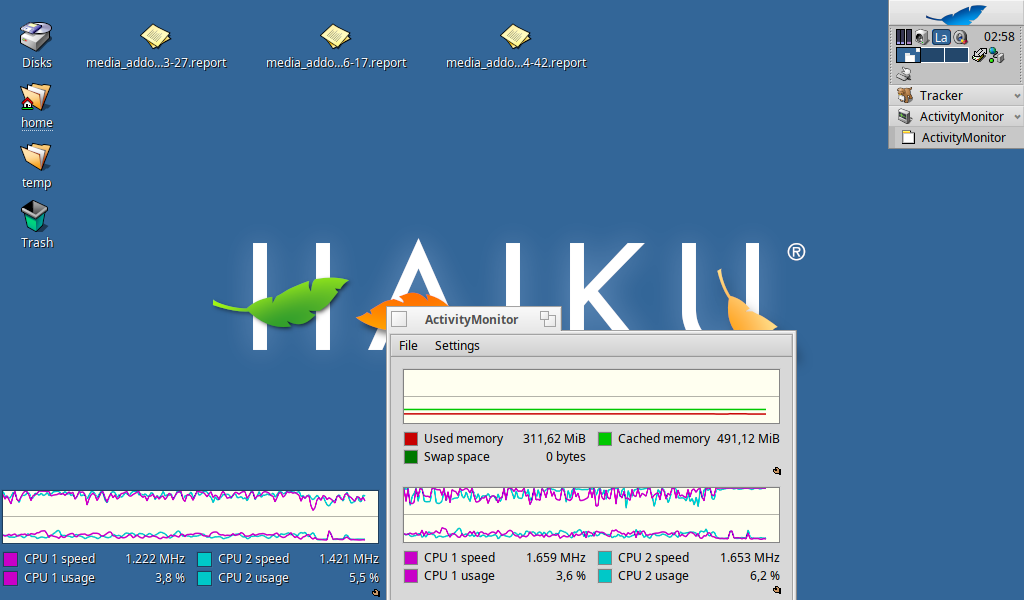
The graph on the main ActivityMonitor *also* shows fluctuations on CPU frequency, but only when the screen-saver is running!?!?
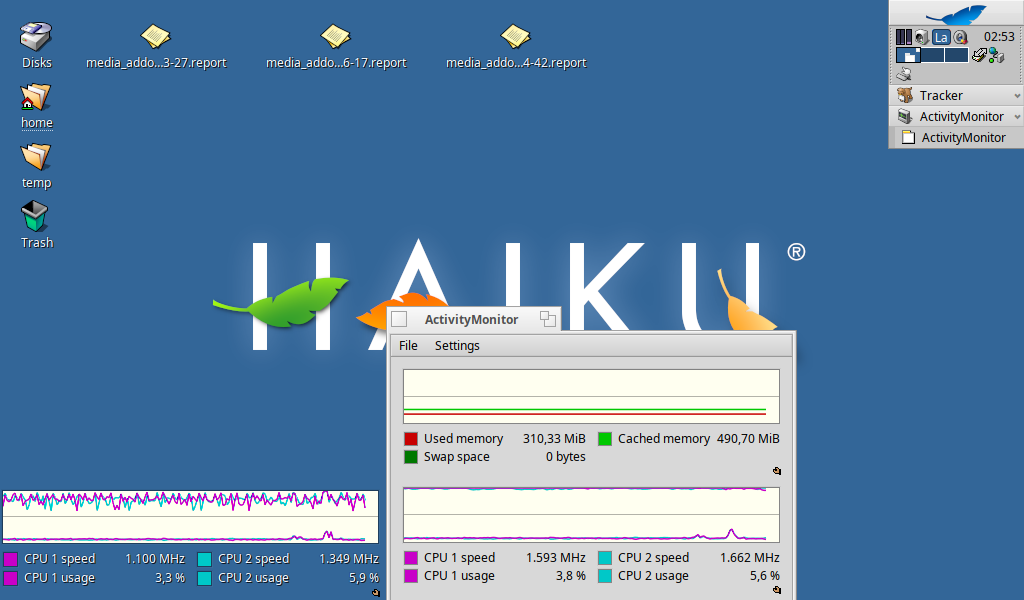
I'm attaching two screenshots. First shows normal values on "main window", wrong ones on "replicant". Second one shows the mentioned "CPU speed drops" on main window after letting the ScreenSaver Icon run for a while.
Notice that on the second screenshot, "replicant" CPU freqs increased in value while the values on the main windows were lower.
I can't replicate this on VBox or bare metal on my Phenom II X4, nor in a Celeron N4020 (none of them has HyperThreading... wonder if that changes things).
Tried to see if there was something obviously wrong in ActivityMonitor's code, but it seems it just uses the info as it gets is from the OS, so I'm not setting the "Component" of this ticket directly to ActivityMonitor.
I *might* be able to test on an Atom N455, if/when it decides to boot with Haiku.
Attachments (2)
Change History (4)
by , 5 months ago
| Attachment: | CPU-Freqs1.png added |
|---|
by , 5 months ago
| Attachment: | CPU-Freqs2.png added |
|---|
Fluctuating CPU Freq on both, after letting the Icon screen saver run for a while. Then "main window" graph goes back to "normal" (notice increased cpu freqs on the "replicant" graph while screensaver was running).
comment:1 by , 5 months ago
| Component: | - General → System/Kernel |
|---|
Indeed it looks like it just fetches the value from the CPU infos struct, so this is probably a kernel bug.
comment:2 by , 4 months ago
Not sure if related, but noticed that on a Celeron N4020 (supported by the intel_pstates driver), at idle, enabling "Power saving" mode seems to increase CPU freqs (at least the reported ones).
Graph with "Power saving" disabled is really flat at idle (reports 795 MHz), and after activating power saving, continually oscillates on the 820-1094 MHz range.
Stable CPU Freq on "main window", fluctuating on "replicant" graph.