

Opened 13 years ago
Closed 13 years ago
#8650 closed bug (fixed)
KDL launching WebPositive development version
| Reported by: | aldeck | Owned by: | anevilyak |
|---|---|---|---|
| Priority: | high | Milestone: | R1 |
| Component: | System | Version: | R1/Development |
| Keywords: | Cc: | bonefish, axeld | |
| Blocked By: | Blocking: | ||
| Platform: | All |
Description
I've got a KDL invariably when running this WebPositive binary (cf. linked archive). Confirmed by Rene that it's not specific to my machine / install.
Haiku hrev44242
Sorry i can't use the keyboard in KDL with this new machine (hand written):
PANIC: breakpoint exception in kernel mode
Thread 252 "pthread func" runing on CPU 1
Attachments (6)
Change History (41)
comment:1 by , 13 years ago
| Cc: | added |
|---|
comment:2 by , 13 years ago
follow-up: 4 comment:3 by , 13 years ago
For anyone who wants to try it: The archive plus the unzipped content need almost 800 MB of free space.
I attached a syslog. The stack trace isn't particularly helpful. There's a long list of page faults in the syslog, many happening in userland, but also quite a few from kernel code. Some earlier ones being writes from arch_cpu_user_strlcpy(). Those most likely stem from a syscall which copies out data to userland, but doesn't check the address given before doing so (unfortunately the check is missing in some code), so it actually tries to overwrite kernel memory. And I guess it actually succeeds in some cases, thus screwing up kernel stack or heap.
follow-up: 5 comment:4 by , 13 years ago
Replying to bonefish:
Those most likely stem from a syscall which copies out data to userland, but doesn't check the address given before doing so (unfortunately the check is missing in some code), ...
So we either proof read every use, or we replace those functions with dedicated functions (ie. something like {memcpy|strlcpy}_{to|from}_user()) which can make the necessary checks themselves. While the current method is more convenient to use, the latter would be much safer to use.
In any case, it might be helpful to check if both arguments are in the kernel to find this problem.
follow-up: 8 comment:5 by , 13 years ago
Replying to axeld:
So we either proof read every use, or we replace those functions with dedicated functions (ie. something like {memcpy|strlcpy}_{to|from}_user()) which can make the necessary checks themselves. While the current method is more convenient to use, the latter would be much safer to use.
I can't say I find the current method particularly convenient, since it always requires the additional IS_USER_ADDRESS() check. So I'd very much like dedicated methods.
In any case, it might be helpful to check if both arguments are in the kernel to find this problem.
Good thinking, but unfortunately there's other kernel code (e.g. the file cache) that does that too, since it is common code and the address may be either kernel or userland address. I did a quick test with a panic() in vm_page_fault() when the fault happened in the kernel and could not be resolved, but when it is triggered, the stack is already corrupted and it is not possible to see where it came from. So maybe it's not an unsafe syscall after all, but the faults are caused by a stack corruption with an entirely different cause. Syscall tracing might help to clarify that point, but I don't really have the time to play with that ATM.
comment:6 by , 13 years ago
When reproducing it over here, the last syscall entries I see are the pre and post for _kern_map_file, followed by a double fault, if that offers any hints. Will see if I can dig in a bit more later.
comment:7 by , 13 years ago
Looked into it a bit more. The faults start immediately after mapping the stack for that thread it appears:
create_anonymous_area [1] pthread func_250_kstack: size 0x4000
map_backing_store: aspace 0x8280af00, cache 0x80fd0380, virtual 0x00000000, offset 0x0, size 16384, addressSpec 4, wiring 2, protection 176, area 0x81b9bca0, areaName 'pthread func_250_kstack'
vm_create_anonymous_area: done
create_anonymous_area [247] pthread func_250_stack: size 0x41000
map_backing_store: aspace 0x80ffb540, cache 0x80fc83f0, virtual 0x70000000, offset 0x0, size 266240, addressSpec 2, wiring 0, protection 59, area 0x81b9bc50, areaName 'pthread func_250_stack'
vm_create_anonymous_area: done
vm_soft_fault: va 0x0 not covered by area in address space
vm_page_fault: vm_soft_fault returned error 'Bad address' on fault at 0xa9, ip 0x8010eea9, write 0, user 0, thread 0xfa
vm_soft_fault: va 0x0 not covered by area in address space
vm_page_fault: vm_soft_fault returned error 'Bad address' on fault at 0xa9, ip 0x8010eea9, write 0, user 0, thread 0xfa
vm_soft_fault: va 0x0 not covered by area in address space
vm_page_fault: vm_soft_fault returned error 'Bad address' on fault at 0xa9, ip 0x8010eea9, write 0, user 0, thread 0xfa
vm_soft_fault: va 0x0 not covered by area in address space
vm_page_fault: vm_soft_fault returned error 'Bad address' on fault at 0x65, ip 0x249dc92, write 0, user 1, thread 0xfa
vm_page_fault: thread "pthread func" (250) in team "WebPositive" (247) tried to read address 0x65, ip 0x249dc92 ("libwebcore.so_seg0ro" +0x1f15c92)
write access attempted on write-protected area 0xd at 0x8010e000
vm_page_fault: vm_soft_fault returned error 'Permission denied' on fault at 0x8010eee3, ip 0x81ba3eb8, write 1, user 0, thread 0xfa
write access attempted on write-protected area 0x18f3 at 0x01f15000
vm_page_fault: vm_soft_fault returned error 'Permission denied' on fault at 0x1f15c92, ip 0x8075ae, write 1, user 0, thread 0xfa
What strikes me as somewhat odd is that the virtual address for its kernel stack is at address 0x0, is that permissible?
follow-up: 9 comment:8 by , 13 years ago
Replying to bonefish:
So maybe it's not an unsafe syscall after all, but the faults are caused by a stack corruption with an entirely different cause. Syscall tracing might help to clarify that point, but I don't really have the time to play with that ATM.
That case unfortunately appears to be the more likely cause. I've gone through and reviewed all usage of user_strlcpy in the kernel, and there doesn't appear to be a tangible culprit to fit the bill as far as that's concerned.
follow-up: 10 comment:9 by , 13 years ago
Replying to anevilyak:
Replying to bonefish:
So maybe it's not an unsafe syscall after all, but the faults are caused by a stack corruption with an entirely different cause. Syscall tracing might help to clarify that point, but I don't really have the time to play with that ATM.
That case unfortunately appears to be the more likely cause. I've gone through and reviewed all usage of user_strlcpy in the kernel, and there doesn't appear to be a tangible culprit to fit the bill as far as that's concerned.
Have you checked the user_memcpy() uses as well? There are significantly more of those.
A kernel stack address of 0 is not permissible, but the address specification is B_ANY_KERNEL_ADDRESS in this case, i.e. the address passed in is ignored. I don't think mapping the stacks has anything to do with the problem. It's just the last VM operation when creating the thread.
If you want to track this further, I'd recommend the following:
- Add a
panic()right after thedprintf()we seen in the syslog (http://cgit.haiku-os.org/haiku/tree/src/system/kernel/vm/vm.cpp#n4037). When I tested it, the stack was already corrupt at that point, so no reason to continue. - Enable kernel tracing for threads and syscalls. This helps to see the syscalls after the creation of the thread until its demise. Whether the cause is a
user_memcpy()or not, it is very likely that the corruption happens in a syscall or code called from it. To help with checking theuser_memcpy()theory add aktrace_printf()in it. Sinceuser_memcpy()in syscalls usually copies from or to the kernel stack, it is probably not easily possible to see whether stack is overwritten erroneously. But maybe something catches the eye (like source and destination addresses both being kernel addresses or a huge copy size). - If the thread overwrites its own stack, then likely the last syscall is to blame (well, there could be an interrupt where this happens, but interrupts happen all the time). Inserting
ktrace_printf()s at some places and enabling stack traces for them (need to be long enough), should help to narrow down when exactly the stack gets broken. - If some other thread overwrites this thread's stack or if the heap is corrupted, things are more complicated. A possible strategy is to try and find out what is corrupted and add respective sanity checks at various places. This would at least narrow it down. Hopefully some more useful lead presents itself.
comment:10 by , 13 years ago
Replying to bonefish:
Have you checked the
user_memcpy()uses as well? There are significantly more of those.
Nope, will do that next though.
A kernel stack address of 0 is not permissible, but the address specification is
B_ANY_KERNEL_ADDRESSin this case, i.e. the address passed in is ignored. I don't think mapping the stacks has anything to do with the problem. It's just the last VM operation when creating the thread.
Oops, overlooked that. Thanks.
[...]
Thanks for the tips! Will see what I can find and report back.
comment:11 by , 13 years ago
With that panic in place, I'm quite reliably getting a backtrace that leads into the user_strlcpy() being called from _user_access(). However, I'm not seeing what's special about that one that's causing corruption, the userspace source address being passed in is 0xa9 with a length of 1024, and the copy in question is targetting the KPath's buffer, so that looks ok in theory apart from the invalid user source address. The thread in question is currently performing a recursive access()/mkdir() pair to completely construct all children of a path, so I don't see anything overly suspicious there, so I'm not quite sure what's so unusual here as to cause stack corruption, unless it already goes wrong while handling the syscall and copying the arguments down (with syscall tracing enabled I sometimes hit the added panic() while adding the syscall pre tracing entry copying a string from userland).
follow-up: 13 comment:12 by , 13 years ago
The stack trace appears to start getting corrupted after the create_dir has executed. If one continues until that point, one then hits a fault directly from the Web+ team itself, rather than from within one of the syscalls. Continuing after that one, the next time the panic is hit, we can no longer trace back into userland with the situation described above. Will dig further.
Edit: BTW, I take it it's not possible for the trace entries to backtrace all the way to the top of the thread's stack? I notice that for me,adding stack traces always winds up with them going as far back as the syscall handler but nothing beyond that (i.e. in userspace).
follow-up: 14 comment:13 by , 13 years ago
It might behave differently on your machine (I tested in a VM with 1 CPU -- I'd recommend that for faster turn-around times). As you can see in the syslog I attached, the first fault happened in the main thread at some completely different address (seems to happen later in your syslog). The stack trace I got ended in a "read fault", so I assumed the stack was already corrupted at that point. It might be worth checking that this isn't just an issue in the stack trace code.
In your case, I don't think that user_strlcpy() has anything to do with the corruption. Given that there are many subsequent calls, it's pretty much guaranteed that it doesn't corrupt the thread's own kernel stack at least (apparently the syscall manages to return to userland and each syscall starts with an empty stack). It's the user_{memcpy,strlcpy}() calls that don't fail which would cause the corruption, anyhow. It is also entirely possible that main thread is corrupting something and the thread that finally crashes is just an innocent bystander.
What I just noticed in my syslog is that it says "kernel stack: 0x80650000 to 0x80654000", but the stack frame addresses are 0x806571ad and greater. So it looks like the thread is running on the wrong stack. For testing purposes the kernel stack check could be relaxed (e.g. !IS_KERNEL_ADDRESS(frame)), so one might get a better stack trace.
Replying to anevilyak:
Edit: BTW, I take it it's not possible for the trace entries to backtrace all the way to the top of the thread's stack? I notice that for me,adding stack traces always winds up with them going as far back as the syscall handler but nothing beyond that (i.e. in userspace).
At least theoretically stack traces can be captured into userland as well. It is not possible in all contexts. BTW, I just noticed that get_next_frame_no_debugger() in src/system/kernel/arch/x86/arch_debug.cpp uses user_memcpy(), so it might not be a good idea to add a ktrace_printf() with stack trace there.
follow-up: 15 comment:14 by , 13 years ago
Replying to bonefish:
In your case, I don't think that
user_strlcpy()has anything to do with the corruption. Given that there are many subsequent calls, it's pretty much guaranteed that it doesn't corrupt the thread's own kernel stack at least (apparently the syscall manages to return to userland and each syscall starts with an empty stack). It's theuser_{memcpy,strlcpy}()calls that don't fail which would cause the corruption, anyhow. It is also entirely possible that main thread is corrupting something and the thread that finally crashes is just an innocent bystander.
Understood.
What I just noticed in my syslog is that it says "kernel stack: 0x80650000 to 0x80654000", but the stack frame addresses are 0x806571ad and greater. So it looks like the thread is running on the wrong stack. For testing purposes the kernel stack check could be relaxed (e.g.
!IS_KERNEL_ADDRESS(frame)), so one might get a better stack trace.
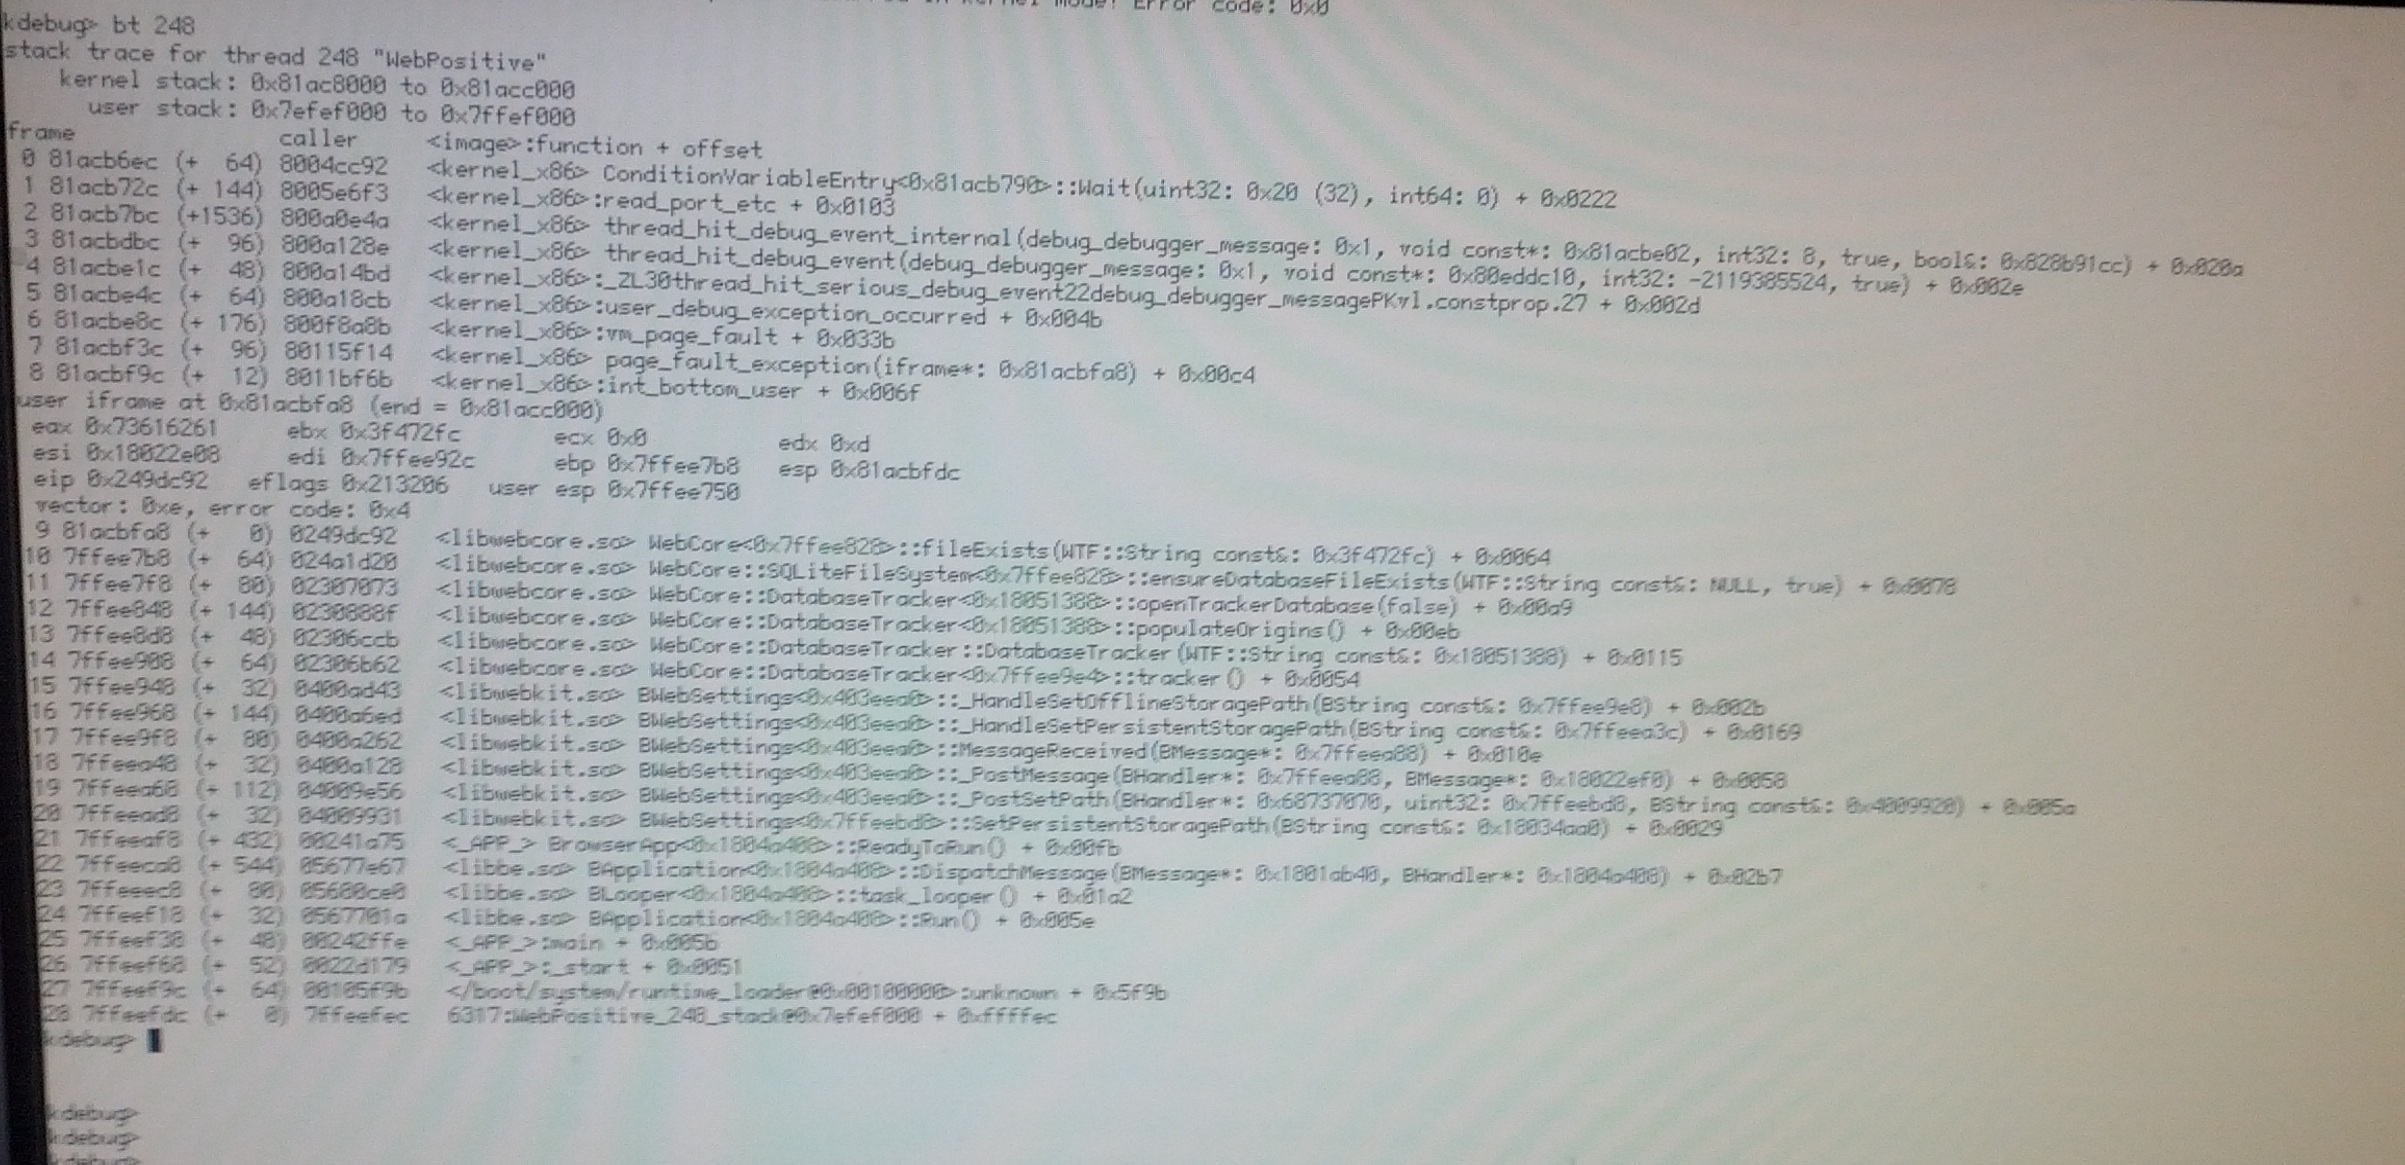
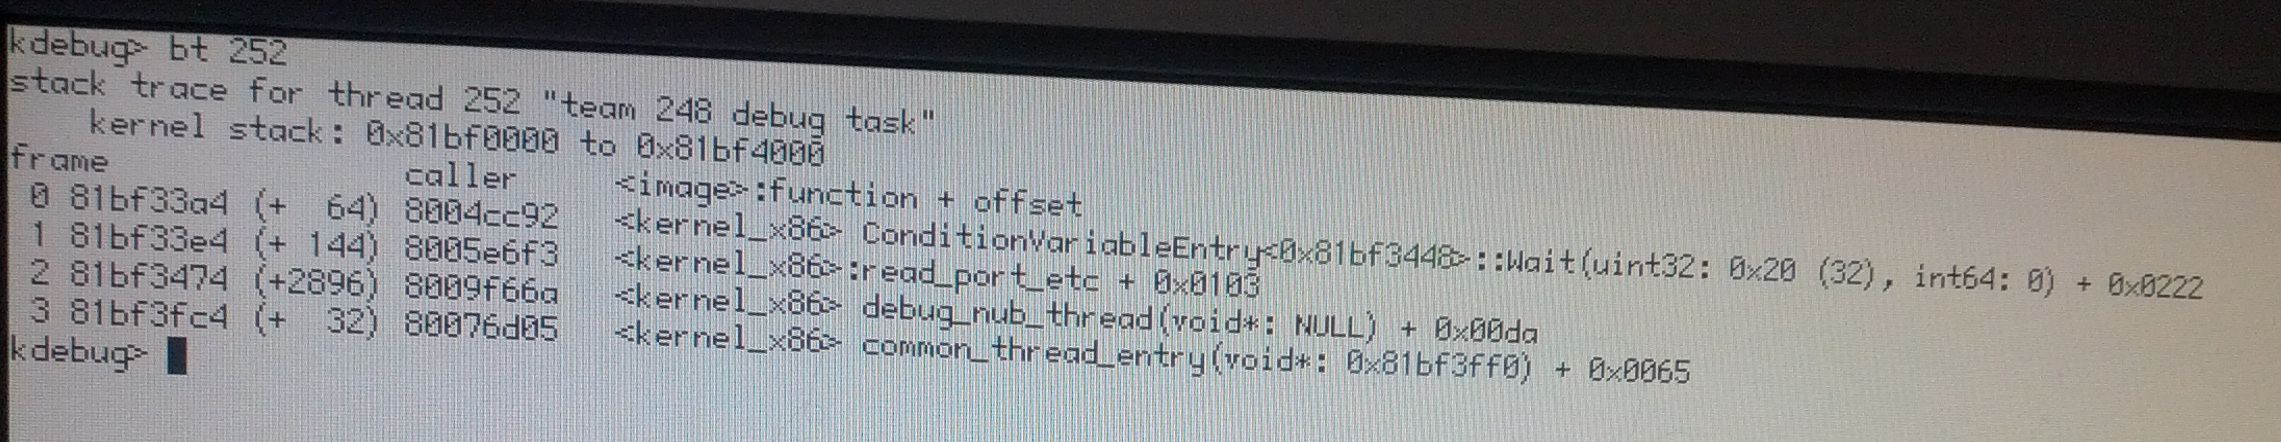
That aspect of it doesn't appear to be the case over at least, the kernel stack matches up with the frame entries for me. One point of note btw, at the point where we hit the "final" panic (which, for me at least, is consistently a General Protection Fault at the moment), there are three threads in the team: 1) the main app thread which is perfectly backtraceable and looks sane for a crashed thread (it's waiting in a condition variable spawned from thread_hit_debug_event_internal -> read_port_etc). 2) The pthread function thread which is no longer traceable, but which up until the point where it started getting corrupted was executing the aforementioned vfs operations, and finally a debug task thread is also attached, also waiting on a condition var from debug_nub_thread(). Since only the pthread appears corrupted, and their stacks are, at least here, quite far apart, it seems improbable that one of the operations the other thread triggered would've been responsible for the corruption, and more likely that the thread corrupted its own.
However, none of the user_memcpy() calls I'm seeing look obviously suspicious, they're all quite small and seem to generally make sense (copying variables back and forth). I'm not seeing any instances of a kernel-to-kernel memcpy happening anywhere in the same general time frame, there are a few while initializing the team and loading shared objects into memory, but those appear to be normal. Could the observed symptoms be possibly due to corruption of the kernel heap, or would that manifest itself a different way?
follow-up: 16 comment:15 by , 13 years ago
Replying to anevilyak:
Could the observed symptoms be possibly due to corruption of the kernel heap, or would that manifest itself a different way?
Anything is possible with heap corruption. The initially reported "breakpoint exception in kernel mode" can only be triggered by executing an int3 instruction, which isn't used in regular kernel code, so non-code is executed. The easiest way to do that is to screw up the stack (and thus a return address), but overwriting a vtable or function pointer on the heap can do the trick just the same.
If you don't have the "read fault" issue with the stack traces, please attach one from after the corruption.
follow-up: 17 comment:16 by , 13 years ago
Replying to bonefish:
If you don't have the "read fault" issue with the stack traces, please attach one from after the corruption.
The thread that actually panics with General Protection Fault for me does have the read fault issue as well at this point unfortunately. Only the other two threads have usable backtraces as described above, and don't really look of interest for debugging this (the main app thread looks like a perfectly normal invalid access from userland leading into the vm and then subsequently the user debugging mechanism). If you'd like to see it regardless, I can attach a trace.
I'm at a bit of a loss at this point unfortunately, I've tried executing this with the guarded heap enabled in the kernel, and that triggers nothing suspicious in the latter, behavior is completely unchanged.
follow-up: 18 comment:17 by , 13 years ago
Replying to anevilyak:
The thread that actually panics with General Protection Fault for me does have the read fault issue as well at this point unfortunately. Only the other two threads have usable backtraces as described above, and don't really look of interest for debugging this (the main app thread looks like a perfectly normal invalid access from userland leading into the vm and then subsequently the user debugging mechanism). If you'd like to see it regardless, I can attach a trace.
Sure, please do.
comment:18 by , 13 years ago
Replying to bonefish:
Sure, please do.
Attached, let me know if there's any additional info I can pull when in this condition, it's completely reliable at ending up this way.
follow-up: 20 comment:19 by , 13 years ago
I your case the stack of the faulting thread definitely looks broken. There are two pieces of information that might be of interest. The first is the fault address (in this case 0x8018492b). It seems to be a kernel address, but the kernel doesn't seem to be able to resolve the symbol. A closer look at the kernel executable (objdump) might give some insight, what this could be.
The other thing is the stack frame address at the point of the fault -- ebp, in this case 0xcec37024. It is an address in the kernel address space, but not on the stack. That might be an object pointer, so maybe this gives a clue who's overwriting the stack. So, please check whether this address belongs to an area, and, if it does and it belongs to the heap/slab, what object cache it is associated with.
Oh, there's actually a third thing: What syscall is this thread currently executing?
follow-up: 22 comment:20 by , 13 years ago
Replying to bonefish:
I your case the stack of the faulting thread definitely looks broken. There are two pieces of information that might be of interest. The first is the fault address (in this case 0x8018492b). It seems to be a kernel address, but the kernel doesn't seem to be able to resolve the symbol. A closer look at the kernel executable (objdump) might give some insight, what this could be.
According to objdump that address is in the .rodata section, within the range of the gcc exception table.
The other thing is the stack frame address at the point of the fault -- ebp, in this case 0xcec37024. It is an address in the kernel address space, but not on the stack. That might be an object pointer, so maybe this gives a clue who's overwriting the stack. So, please check whether this address belongs to an area, and, if it does and it belongs to the heap/slab, what object cache it is associated with.
It doesn't appear to match any active areas unfortunately.
Oh, there's actually a third thing: What syscall is this thread currently executing?
The last trace entry I have for syscalls in that team is the post-syscall entry for _kern_create_dir, which failed with B_BAD_ADDRESS.
comment:21 by , 13 years ago
If it offers any further hint by the way, as an experiment I tried adding guards to _user_create_dir() and _user_access() such that they short circuit and return B_BAD_ADDRESS if the user address in question is within the range 0 -> B_PAGE_SIZE - 1 (without trying to invoke user_memcpy()). If that guard is in place, Web+ simply crashes in userland as expected, though asking to debug it from debug_server's dialog box doesn't result in invoking gdb as expected.
follow-up: 23 comment:22 by , 13 years ago
Replying to anevilyak:
The last trace entry I have for syscalls in that team is the post-syscall entry for _kern_create_dir, which failed with B_BAD_ADDRESS.
Is that the last entry for the thread or just for the team? Given that short-circuiting the syscalls suggests that the corruption happens in one of them. So it would help to find out which one. I consider it more likely that it corrupts the stack of its own thread. Once it is clear which one I would add stack sanity asserts to narrow it down to the point where the bad things happen.
comment:23 by , 13 years ago
Replying to bonefish:
Is that the last entry for the thread or just for the team? Given that short-circuiting the syscalls suggests that the corruption happens in one of them. So it would help to find out which one. I consider it more likely that it corrupts the stack of its own thread. Once it is clear which one I would add stack sanity asserts to narrow it down to the point where the bad things happen.
It was for both the team and the thread. Unfortunately, I'm afraid I'm going to have to admit that the heat here has been getting to my brain and I got my function names mixed up. It was actually user_strlcpy() and user_memcpy() in vm.cpp that I put those guards in. After some further testing, the one in user_strlcpy() alone suffices it seems. Digging further to see if I can determine where the suspicious invocation is coming from, but crafting a panic condition that finds it without inducing false positives in e.g. the tracing code is proving a bit non-trivial. Will let you know.
comment:24 by , 13 years ago
I'm starting to suspect a code generation bug: If one changes the check in user_strlcpy from simply checking if the destination address is within the first page to also checking if the size != 0, we wind up with the same exact corruption situation. If, however, I remove that safety check from user_strlcpy entirely, and simply add a ktrace_printf at http://cgit.haiku-os.org/haiku/tree/src/system/kernel/arch/x86/arch_cpu.cpp#n999 (by converting the if to a multiline if that ktrace_printf's, then executes the goto), we no longer panic and the app crashes in userland as expected. Furthermore, dropping into KDL and examining the trace buffer after said crash reveals that the above mentioned ktrace_printf is never hit.
follow-up: 26 comment:25 by , 13 years ago
I assume you're using gcc4 as the kernel compiler as well?
The code has always been a bit problematic. We had to adjust it already once or twice, since it broke with a compiler update. I suppose we should stop trying to "trick" the compiler and go with an assembly implementation for arch_cpu_user_strlcpy() and arch_cpu_user_memset() (we apparently already did for arch_cpu_user_memcpy()).
Other fault handler uses should be checked as well. Not sure, if there even are any left.
comment:26 by , 13 years ago
Replying to bonefish:
I assume you're using gcc4 as the kernel compiler as well?
Correct.
I suppose we should stop trying to "trick" the compiler and go with an assembly implementation for
arch_cpu_user_strlcpy()andarch_cpu_user_memset()(we apparently already did forarch_cpu_user_memcpy()).
Sounds reasonable, I'm afraid I'd have to defer that task to someone else though, as my assembly experience is limited at best, and in the case of x86 in particular, entirely nonexistent.
Other fault handler uses should be checked as well. Not sure, if there even are any left.
I'll look around and see if I spot any others.
comment:27 by , 13 years ago
Those appear to be the only usages, along with their counterparts in the other architectures.
comment:28 by , 13 years ago
| patch: | 0 → 1 |
|---|
by , 13 years ago
| Attachment: | user_strlcpy.patch added |
|---|
follow-up: 30 comment:29 by , 13 years ago
Attached a patch that implements arch_cpu_user_strlcpy and arch_cpu_user_memset in asm. The memset implementation appears to work, but something is still wrong with user_strlcpy, if I include that one we don't initialize userland properly, though the syslog up until that point looks generally sane (KDL can be entered). Not entirely sure what's wrong there though, review welcome.
comment:30 by , 13 years ago
Replying to anevilyak:
Attached a patch that implements arch_cpu_user_strlcpy and arch_cpu_user_memset in asm. The memset implementation appears to work, but something is still wrong with user_strlcpy, if I include that one we don't initialize userland properly, though the syslog up until that point looks generally sane (KDL can be entered). Not entirely sure what's wrong there though, review welcome.
http://www.agner.org/optimize/#asmlib - I do not know. But it may be useful.
follow-up: 33 comment:31 by , 13 years ago
arch_cpu_user_memset() looks OK. I see the following problems in arch_cpu_user_strlcpy():
- size == 0 should be handled.
- The null termination should not happen before copying. One, it may touch a byte that doesn't need to be touched (not so nice for performance reasons). And two, the byte is overwritten, when the string is too long. The C implementation does it the same way, but decrements the size, thus at least not overwriting the null.
- The return value is computed incorrectly. It should be the length of the source string.
I would implement it like (pseudo C/assembly):
save registers, load args, setup fault handler;

if (ecx == 0)
  goto find_end_of_source;

ecx--;
repnz movsb;

if (ecx == 0) {
  *edi = '\0'; // edi points to last byte in buffer
  esi--;       // set esi to the last copied byte (might be the null)
find_end_of_source:
  not ecx;     // as many repetitions as possible
  repnz lodsb; // advance until after reading the terminating null
}

// esi points to the byte after the terminating null
eax = esi - source - 1;

restore fault handler, restore registers;
Note, lodsb overwrites al, so eax cannot be used to save the old fault handler. ebx is no longer used, though.
comment:32 by , 13 years ago
| Owner: | changed from to |
|---|---|
| Status: | new → in-progress |
comment:33 by , 13 years ago
| Resolution: | → fixed |
|---|---|
| Status: | in-progress → closed |
comment:34 by , 13 years ago
| Resolution: | fixed |
|---|---|
| Status: | closed → reopened |
Seems there's still a problem in user_strlcpy, will dig in tonight.
comment:35 by , 13 years ago
| Resolution: | → fixed |
|---|---|
| Status: | reopened → closed |
Regressions should be fixed in hrev44282.
PS: There's possibly a mix-up of release/debug version of one of the libs or individual objetcs if it matters.