

Opened 10 years ago
Closed 2 years ago
#10454 closed task (fixed)
New scheduler: substantial performance drop
| Reported by: | stippi | Owned by: | pdziepak |
|---|---|---|---|
| Priority: | high | Milestone: | Unscheduled |
| Component: | System/Kernel | Version: | R1/Development |
| Keywords: | Cc: | ||
| Blocked By: | #10487 | Blocking: | |
| Platform: | All |
Description (last modified by )
I've already made Pawel aware of it, but wanted it logged, that the new scheduler comes with a substantial drop in performance for certain work loads. I've timed the Haiku revision before the merge building HaikuDepot (after jam clean). These are my timings:
jam -q -j4 HaikuDepot

Haiku old scheduler:
real    0m58.340s
user    2m25.305s
sys     0m52.408s

real    0m57.608s
user    2m25.175s
sys     0m52.455s


Haiku, new scheduler:
real    1m40.426s
user    2m23.923s
sys     0m42.496s

real    1m40.283s
user    2m23.842s
sys     0m42.488s


Ubuntu 12.04:
real	0m24.603s
user	1m5.592s
sys	0m5.376s

real	0m24.620s
user	1m5.720s
sys	0m5.268s
The system time actually improved, but the overall time for the concurrent jobs is much worse than before. Looing at ActivityMonitor, the thread migration between cores seems to be the problem, because each core peaks only for short times, while with the old scheduler, the cores stay peaked.
Both Haiku images had been compiled with KDEBUG_LEVEL = 0 and the code was compiled on a BFS partition that has query support. In case of Linux, the code was on a ReiserFS partition on the same SSD. Compiler was GCC2 in all tests.
Attachments (1)
Change History (32)
comment:1 by , 10 years ago
| Description: | modified (diff) |
|---|
comment:2 by , 10 years ago
| Description: | modified (diff) |
|---|
comment:3 by , 10 years ago
| Description: | modified (diff) |
|---|
comment:4 by , 10 years ago
comment:5 by , 10 years ago
| Status: | new → in-progress |
|---|
comment:6 by , 10 years ago
| Blocked By: | 10487 added |
|---|
comment:7 by , 10 years ago
Tested hrev46810 for the effects of recent changes that seemed to have to do with this ticket. It got a little better and a little worse:
real    1m44.925s
user    2m24.451s
sys     0m37.439s

real    1m44.349s
user    2m24.526s
sys     0m37.569s
System time has improved yet again, while overall time for this task takes almost 5 seconds more since the initial merge. I am not even sure the observation that it has mainly to do with thread migration is even correct. That would mean that there should be one or two cores that are peaked during an interval, while others have nothing to do. But all my four cores have mostly nothing to do while the compile runs. Activity Monitor reports loads as low as 17 % during a half-second average for a core, and most cores don't go beyond 70% load.
comment:8 by , 10 years ago
I am almost convinced this has nothing to do with thread migration. First of all, it was news to me that the observed behavior is apparently hardware-specific, for other people it works just fine and the new scheduler is faster, some are in the same boat as me. Secondly, I am observing "short freezes", which I now think may be related: I mostly notice that while typing in Pe, sometimes the text caret does not react, and then several chars that I just typed in the last second or two appear at once... so somewhere, sometimes a delay happens that prevents threads from running when they should. Maybe the delay is always there but varies in length, with the average length having the observed effect on overall compile time, and the longest length giving a noticeable delay while typing.
My hardware is a Core i5 quad:
Intel(R) Core(TM) i5-3570 CPU @ 3.40GHz
family(6) model(58) stepping(9)
fpu vme de pse tsc msr pae mce cx8 apic mtrr pge mca cmov pat pse36 clflush dts acpi mmx fxsr sse sse2 ss ht tm pbe nx rdtscp lm constant_tsc arch_perfmon pebs bts xtopology nonstop_tsc aperfmperf pni pclmulqdq dtes64 monitor ds_cpl vmx smx est tm2 ssse3 cx16 xtpr pdcm pcid sse4_1 sse4_2 x2apic popcnt tsc_deadline_timer aes xsave avx f16c rdrand lahf_lm ida arat epb xsaveopt pln pts dtherm tpr_shadow vnmi flexpriority ept vpid fsgsbase smep erms
Anything else I should follow up on to help investigate?
comment:9 by , 10 years ago
a delay/lockup like this may be caused by other hardware in the machine (with interrupts, or waiting for disk access, or something else). Listdev output on affected machines may help pinning the problem.
comment:10 by , 10 years ago
Well, thread migration definitely is not working properly when it has to deal with a large amount of short lived tasks. hrev46810 contains only work toward fixing that issue not a complete fix. Also, the fact that none of the cores reaches 100% load in a half-second average doesn't tell much what is really happening there. The scheduler operates on much shorter time intervals. I have several patches that help to mitigate this thread migration problem and I will push at least some of them later today.
"Short freezes" are rather more worrying issue. Are they system-wide or affect just one application? Or perhaps only mouse/keyboard input is affected? If you can enter KDL during one of such freezes it would be interesting to see if there are any running or ready threads, how they are assigned to cores and how cores are ranked (useful commands: "running", "ready", "run_queue", "cpu_heap").
comment:11 by , 10 years ago
It is hard to tell whether the short freezes are related. I have definitely seen freezes in mouse events (1 - 3 secs) on this machine from time to time (before the scheduler merge). These are USB related, the syslog has entries similar to "USB port reset". It gets really bad when I connect my Wacom Intuos 2 tablet. This is definitely unrelated. The short delays while typing only happen very infrequently and I can say that I got aware of them after the scheduler merge, but they might have been there before and might be related to the mouse freezes. I can keep a tail -F syslog open the next time I do some Haiku work. That should clear up at least this issue.
My musings about the mysterious latency might not make much sense. I told you that when I run the WonderBrush prototype which uses as much render threads as there are CPU cores, I see those cores all pegged. They wouldn't be if threads are not always allowed to run when they can.
To think about the problem as something thread migration related still has some question marks for me. A new task should be scheduled immediately, even when it is short lived. It is either scheduled on a CPU with less load, or on a CPU which is already full, in which case it runs later than it could. If this theory is based on facts, then there should always be at least one CPU under full load. You are saying this may still be the case, only that Activity Monitor misleads by measuring load over such a long interval?
comment:12 by , 10 years ago
There was a delay before thread migration and effect of that migration becoming visible in the load statistics. That caused scheduler in some circumstances to migrate virtually all active threads to a single core (the best fit at that specific moment) then, after updating load statistics, the scheduler would realize that there is an overloaded core and migrate most of the active threads to a single core that currently is the best fit. Basically, this would cause each core to be overloaded for a short period of time while the others are idle. Average load would look like none of the cores reaches 100% load.
The situation will eventually stabilize as load statistics updates were not synchronized in any way with thread migration and that's why the problem doesn't significantly affect long lived threads (e.g. that WonderBrush prototype).
Anyway, hrev46824 should make things at least a bit better.
comment:13 by , 10 years ago
It definitely improved things quite a bit (second and third runs):
real    1m5.878s
user    2m25.134s
sys     0m41.105s

real    1m5.652s
user    2m25.156s
sys     0m40.971s
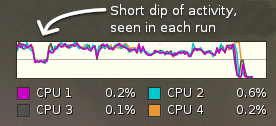
The effect is that load is spread across all cores much more consistently. However, there are some curious effects still to be observed. When the compile test begins, after jam collected targets, load jumps to between 80% and 90% on all cores, but slowly decreases over the duration of the test. It could be dependent on what exactly is compiling, as there is a short dip of load at a consistent time during the compile. I am attaching a screenshot of the Activity Monitor graphs.
comment:14 by , 10 years ago
As of hrev46944 scheduling_recorder works again. As Ingo pointed out, it might be really useful to find out what is happening here.
comment:15 by , 10 years ago
I've noticed recently that the scheduler tends to keep one core unoccupied despite having correct core load statistics. That behaviour is not shown on the graph Stephan posted, but still, it is apparently some oversight in thread migration logic.
There is also another potential cause for these performance problems which, actually, has already worried me for some time, but I never looked into it more closely. When a core is chosen for a thread (in low latency mode) the scheduler first considers cores that are currently idle. The purpose of that is to allow the thread to run immediately. However, core with 90% is idle for 10% of the time and in worst-case scenario may be chosen by the scheduler even if there were much less occupied cores. The fix for that shouldn't be very complicated (testing the impact of that fix probably would take more time, though), all that needs to be done is not allow cores with a load above certain threshold in idle core list.
I am going to address these issues in a few days.
comment:16 by , 10 years ago
hrev46947 and hrev46999 address some oversights that might have quite noticeable impact on the performance (namely, the problem with leaving one core unoccupied). I did quick UnixBench run to verify that there is no regression anywhere but I have not done any proper compile performance tests yet. There is still the other potential problem I mentioned in a previous post.
comment:17 by , 10 years ago
follow-up: 19 comment:18 by , 10 years ago
The scheduling keeps my core I7 quad system unusable for any sort of media processing or games with sound. Around 20 seconds after booting up, menu navigation becomes unresponsive. Really looks as if especially small tasks get delayed for multiple seconds sometimes, including audio buffer transfers, keyboard and mouse click responses etc.. Building Haiku in parallel or other batch tasks with single-threaded parallel processes fly though.
Pretty sure I spotted one bug in scheduler.cpp - scheduler_set_thread_priority, line 184ff. where the test on the new priority being different to the current on occurs after the new on is set, so that the priority update never really happens.
Will look into other points but that should probably be fixed, simply by checking against oldPriority instead of thread->priority in line 184.
comment:19 by , 10 years ago
Replying to fishpond:
Pretty sure I spotted one bug in scheduler.cpp - scheduler_set_thread_priority, line 184ff. where the test on the new priority being different to the current on occurs after the new on is set, so that the priority update never really happens.
Reviewing the last commit that does affect this code (hrev46809), you're right, it seems the check is now wrong.
comment:20 by , 9 years ago
Problem is fixed for me - I suspect the fix to #12286 being responsible. I'd expect the fix to cover quite a range of existing tickets.
Totally changes usability of Haiku to the positive for me - thanks a lot.
comment:21 by , 9 years ago
#12286 fixed a regression introduced very recently (this month) in Haiku. So it's definitely not related to this. Good to know your issue is fixed, still.
Leaving this open, unless stippi can run the test again on the same hardware and confirm the performance is back to what it was before.
comment:22 by , 9 years ago
Hi Pulkomandy - sorry, more boots showed that neither #12237 ([launch_daemon] boot hangs at rocket icon) nor this one have really gone away. The strange thing was that on two boots that were successfully passing the rocket icon, the system was not showing stutter anymore. As far as I can see, the launch_daemon operates with interdependent control and worker threads, which would make it especially vulnerable to a thread not starting. So, I tend to suspect the two problems to be interrelated. I'll try some more things and will keep results posted here.
comment:24 by , 6 years ago
I think the computer I am typing this on is still the same one. I need to build my own Haiku image in order for it to be comparable (KDEDUG=0). Then I need to check out the same revision of HaikuDepot used for the test and run a compile. I hope such old Haiku code bases still compile on the current Haiku. If I can't test it, we may as well close the ticket. Don't know when I will have time to try. Please leave open for now.
comment:25 by , 6 years ago
Well, even if you can't build said ancient revision, a similar test of building HaikuDepot on Haiku vs Linux may be worthwhile.
comment:26 by , 6 years ago
Yes, but the meaningful comparission is between Haiku with the old scheduler and the current Haiku version, no? One could only extrapolate the old and new difference between Linux and Haiku, taking into account the difference between Linux then and now... :-) It wouldn't be a test quite as robust as simply comparing the two Haiku versions on the same hardware doing the exact same task.
comment:28 by , 4 years ago
I think this ticket has little value now. The original comparison will be too hard to reproduce, a lot of other things besides the scheduler are also probably involved (disk IO, various optimizations in many places, ...). We should rather compare ourselves to Linux, FreeBSD or other operating systems.
comment:29 by , 4 years ago
I agree about closing this ticket. Specific tickets can be created as needed.
comment:30 by , 4 years ago
| Milestone: | R1 → Unscheduled |
|---|
comment:31 by , 2 years ago
| Resolution: | → fixed |
|---|---|
| Status: | in-progress → closed |
Based on the above notes, it appears the new scheduler was within 10-15% of the old one at the time stippi last tested, not worse than double like it was originally, and indeed we have made many more improvements since then. So I agree this ticket can be closed at this point.
Just to rule out this is a time tracking glitch, did you check the real time on wall clock for comparison?
Both user and system time are comparable or better. The detrimental effect of core hopping is mainly with respect to cache efficiency, which would increase user and/or system time. It wouldn't explain why only the real time is worse. Additional wait times and scheduling latencies would be an explanation. A stronger CPU affinity usually comes at the cost of the latter. The trick is to find a balance where the positive effects maximally outweigh the negative ones in almost all situations.
I don't know if scheduling_recorder and DebugAnalyzer do still work. They would be very handy for analyzing such a problem.