

Opened 16 years ago
Closed 15 years ago
#2557 closed bug (fixed)
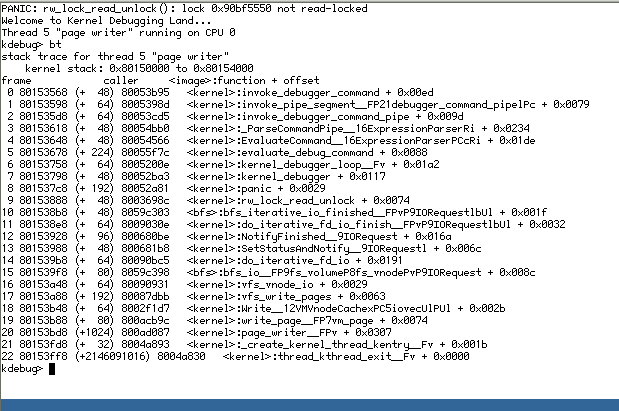
PANIC: rw_lock_read_unlock(): lock 0x90bf5550 not read-locked
| Reported by: | scottmc | Owned by: | axeld |
|---|---|---|---|
| Priority: | normal | Milestone: | R1/alpha1 |
| Component: | System/Kernel | Version: | R1/alpha1 |
| Keywords: | Cc: | ||
| Blocked By: | Blocking: | ||
| Platform: | All |
Attachments (3)
Change History (9)
by , 16 years ago
| Attachment: | rw_lock_read_unlock.png added |
|---|
by , 16 years ago
| Attachment: | rw_lock_read_unlock2.png added |
|---|
comment:1 by , 16 years ago
comment:2 by , 16 years ago
| Component: | - General → System/Kernel |
|---|
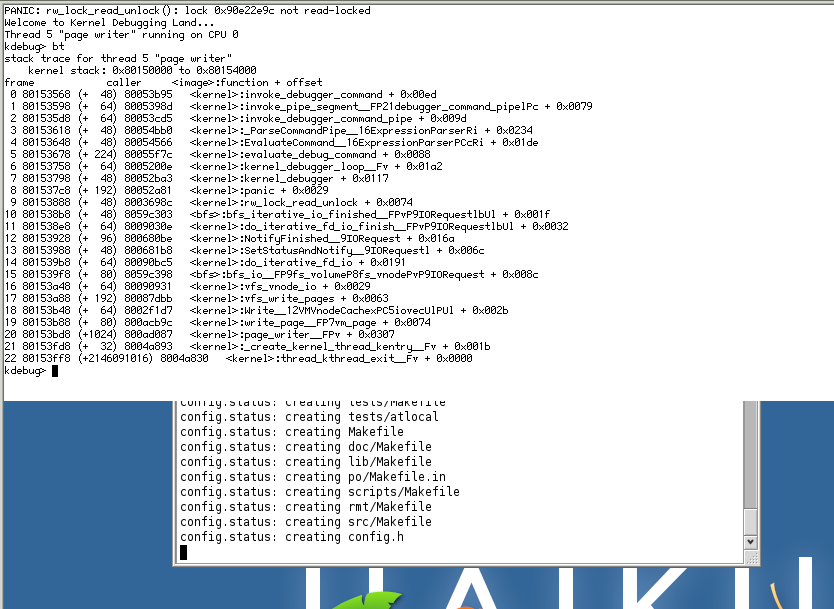
I can confirm this one on 26751 also:
stack trace for thread 5 "page writer"
    kernel stack: 0x80157000 to 0x8015b000
frame            caller     <image>:function + offset
 0 8015a568 (+  48) 80056fd5   <kernel>:invoke_debugger_command + 0x00ed
 1 8015a598 (+  64) 80056dcd   <kernel>:invoke_pipe_segment__FP21debugger_command_pipelPc + 0x0079
 2 8015a5d8 (+  64) 80057115   <kernel>:invoke_debugger_command_pipe + 0x009d
 3 8015a618 (+  48) 80057ff0   <kernel>:_ParseCommandPipe__16ExpressionParserRi + 0x0234
 4 8015a648 (+  48) 800579a6   <kernel>:EvaluateCommand__16ExpressionParserPCcRi + 0x01de
 5 8015a678 (+ 224) 800593bc   <kernel>:evaluate_debug_command + 0x0088
 6 8015a758 (+  64) 8005544e   <kernel>:kernel_debugger_loop__Fv + 0x01ae
 7 8015a798 (+  48) 80055fe3   <kernel>:kernel_debugger + 0x0117
 8 8015a7c8 (+ 192) 80055ec1   <kernel>:panic + 0x0029
 9 8015a888 (+  48) 8003896c   <kernel>:rw_lock_read_unlock + 0x0074
10 8015a8b8 (+  48) 807a07c6   <bfs>:iterative_io_finished_hook__FPvP9IORequestlbUl + 0x0022
11 8015a8e8 (+  64) 800953e6   <kernel>:do_iterative_fd_io_finish__FPvP9IORequestlbUl + 0x0032
12 8015a928 (+  96) 8006d126   <kernel>:NotifyFinished__9IORequest + 0x016a
13 8015a988 (+  48) 8006d220   <kernel>:SetStatusAndNotify__9IORequestl + 0x006c
14 8015a9b8 (+  64) 80095ca9   <kernel>:do_iterative_fd_io + 0x0191
15 8015a9f8 (+  80) 807a154f   <bfs>:bfs_io__FP9fs_volumeP8fs_vnodePvP9IORequest + 0x008f
16 8015aa48 (+  64) 80095a15   <kernel>:vfs_vnode_io + 0x0029
17 8015aa88 (+ 192) 8008ce9f   <kernel>:vfs_write_pages + 0x0063
18 8015ab48 (+  64) 800311a7   <kernel>:Write__12VMVnodeCachexPC5iovecUlPUl + 0x002b
19 8015ab88 (+  80) 800b1db8   <kernel>:write_page__FP7vm_page + 0x0074
20 8015abd8 (+1024) 800b22a3   <kernel>:page_writer__FPv + 0x0307
21 8015afd8 (+  32) 8004d0cf   <kernel>:_create_kernel_thread_kentry__Fv + 0x001b
22 8015aff8 (+2146062344) 8004d06c   <kernel>:thread_kthread_exit__Fv + 0x0000

mutex 0xc2e8e554:
  name:            bfs inode 40.38
  flags:           0x0
  holder:          307
  waiting threads:

thread 307:
THREAD: 0x916d9000
id:                 307 (0x133)
name:               "jam"
all_next:           0x916bf800
team_next:          0x00000000
q_next:             0x80102fe0
priority:           10 (next 10)
state:              ready
next_state:         ready
cpu:                0x00000000
sig_pending:        0x0 (blocked: 0x0)
in_kernel:          1
fault_handler:      0x00000000
args:               0x910d47f8 0x00000000
entry:              0x80049d48
team:               0x90e37ba0, "jam"
  exit.sem:         23892
  exit.status:      0x0 (No error)
  exit.reason:      0x0
  exit.signal:      0x0
  exit.waiters:
kernel_stack_area:  7721
kernel_stack_base:  0xa10da000
user_stack_area:    7723
user_stack_base:    0x7efef000
user_local_storage: 0x7ffef000
kernel_errno:       0x0 (No error)
kernel_time:        46873355
user_time:          13489276
flags:              0x200
architecture dependant section:
        esp: 0xa10ddcb8
        ss: 0x00000010
        fpu_state at 0x916d9380
This was during the patience... section of jam -aq.
comment:3 by , 16 years ago
| Resolution: | → fixed |
|---|---|
| Status: | new → closed |
Should be fixed in hrev26776. I couldn't reproduce the exact problem, but in certain error situations the request finished hook was invoked twice, which would perfectly explain this situation.
comment:4 by , 15 years ago
| Resolution: | fixed |
|---|---|
| Status: | closed → reopened |
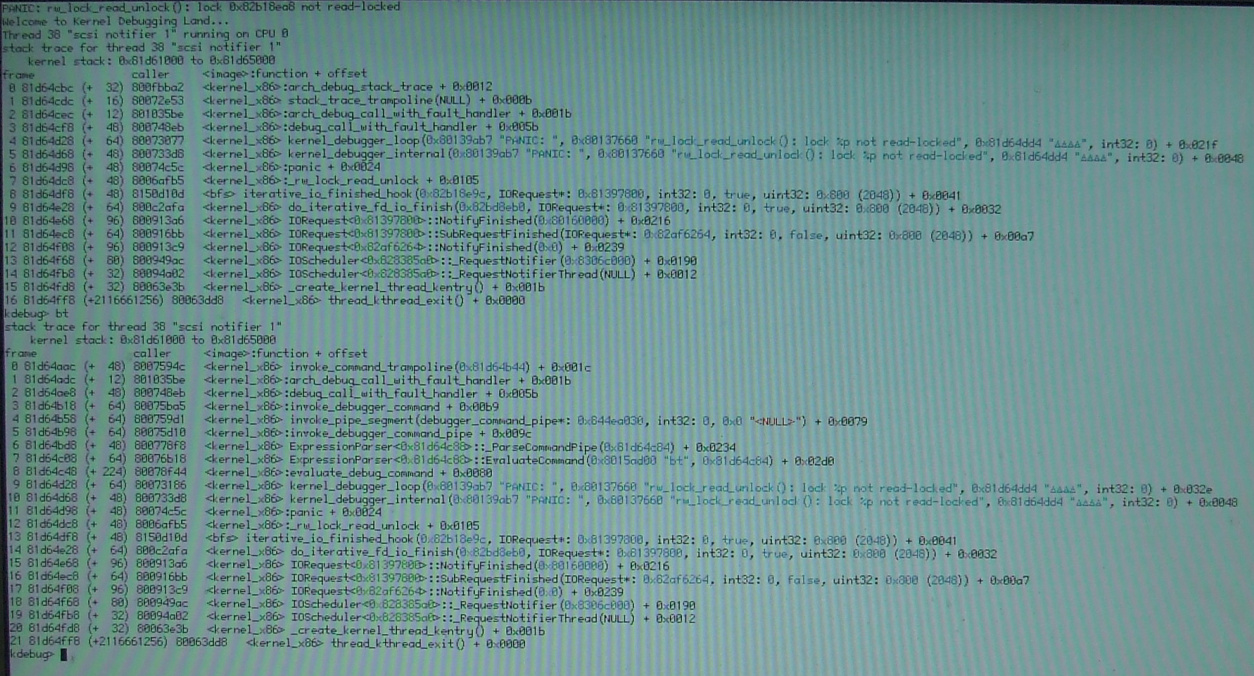
By quiting Tracker in ProcessController. Tested on haiku-r1a2-rc-hrev36542. See atached picture.
by , 15 years ago
| Attachment: | panicbyquittrackerinpcontr.jpg added |
|---|
Panic by quiting Tracker ir ProcessController
comment:5 by , 15 years ago
| Milestone: | R1 → R1/alpha2 |
|---|---|
| Version: | R1/pre-alpha1 → R1/alpha1 |
comment:6 by , 15 years ago
| Milestone: | R1/alpha2 → R1/alpha1 |
|---|---|
| Resolution: | → fixed |
| Status: | reopened → closed |
Looks like a different problem. Please open a new ticket.
Note:
See TracTickets
for help on using tickets.
Just a hint for next time. Use the mutex command with the exadecimal number of the lock. It'll give devs useful information about the mutex.
As for the bug is doesn't seem related to #2555. This one has more to do with the recent commit hrev26671 where the function was added. I'm not sure, but the lock seems double referenced.