

#2008 closed bug (fixed)
KDL: when running 'svn up' on haiku-host (r24742)
| Reported by: | kaoutsis | Owned by: | axeld |
|---|---|---|---|
| Priority: | blocker | Milestone: | R1 |
| Component: | System/Kernel | Version: | R1/pre-alpha1 |
| Keywords: | Cc: | anevilyak | |
| Blocked By: | Blocking: | ||
| Platform: | All |
Description
vm_soft_fault: va 0xdeadbeef not covered by area in address space
vm_page_fault: vm_soft_fault returned error 'Bad address' on fault at 0xdeadbeef, ip 0xdeadbeef, write 0, user 0, thread 0x9
CPU 1 halted!
PANIC: vm_page_fault: unhandled page fault in kernel space at 0xdeadbeef, ip 0xdeadbeef
Welcome to Kernel Debugging Land...
Running on CPU 0
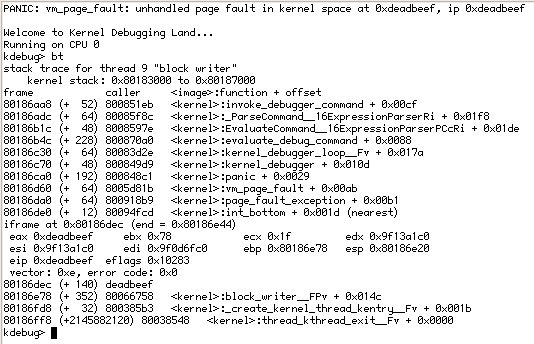
kdebug> where
stack trace for thread 9 "block writer"
kernel stack: 0x80183000 to 0x80187000
frame caller <image>:function + offset
80186aa8 (+ 52) 8008523b <kernel>:invoke_debugger_command + 0x00cf
80186adc (+ 64) 80085fdc <kernel>:_ParseCommand__16ExpressionParserRi + 0x01f8
80186b1c (+ 48) 800859ce <kernel>:EvaluateCommand__16ExpressionParserPCcRi + 0x01de
80186b4c (+ 228) 800870f0 <kernel>:evaluate_debug_command + 0x0088
80186c30 (+ 64) 80083d7e <kernel>:kernel_debugger_loop__Fv + 0x017a
80186c70 (+ 48) 80084a29 <kernel>:kernel_debugger + 0x010d
80186ca0 (+ 192) 80084911 <kernel>:panic + 0x0029
80186d60 (+ 64) 8005d8cb <kernel>:vm_page_fault + 0x00ab
80186da0 (+ 64) 80091909 <kernel>:page_fault_exception + 0x00b1
80186de0 (+ 12) 8009501d <kernel>:int_bottom + 0x001d (nearest)
iframe at 0x80186dec (end = 0x80186e44)
eax 0xdeadbeef ebx 0x0 ecx 0x1 edx 0x91101980
esi 0x91101980 edi 0x910d5c20 ebp 0x80186e78 esp 0x80186e20
eip 0xdeadbeef eflags 0x10283
vector: 0xe, error code: 0x0
80186dec (+ 140) deadbeef
80186e78 (+ 352) 800667c8 <kernel>:block_writer__FPv + 0x0138
80186fd8 (+ 32) 80038663 <kernel>:_create_kernel_thread_kentry__Fv + 0x001b
80186ff8 (+2145882120) 800385f8 <kernel>:thread_kthread_exit__Fv + 0x0000
kdebug>
- get the subversion pkg
- run 'svn up'
- after a few seconds the kdl will come up
i reproduce the kdl every time, if i skip the 'svn up' and do a 'jam -q haiku-image' on haiku-host after a few minutes i get the same kdl
this happen only after this revision. Two, three days ago, i had no problem with svn up and the 'jam -q haiku-image' never showed kdl
Attachments (4)
Change History (33)
by , 17 years ago
| Attachment: | block_writer_kdl_r24742.txt added |
|---|
comment:1 by , 17 years ago
| Resolution: | → fixed |
|---|---|
| Status: | new → closed |
comment:2 by , 17 years ago
| Component: | - General → System/Kernel |
|---|---|
| Priority: | normal → blocker |
comment:3 by , 17 years ago
| Resolution: | fixed |
|---|---|
| Status: | closed → reopened |
I run into the same issue on hrev24750, attached a photo of the backtrace.
comment:4 by , 17 years ago
I can confirm that the bug still exists as I just got sent to KDL when compiling Haiku. I will attach a clearer kdl image but it looks exactly like the one posted by ddew.
comment:5 by , 17 years ago
I have the same issue with hrev24750, for me it kdl'ed when i launched MediaPlayer.
comment:6 by , 17 years ago
| Cc: | added |
|---|
comment:7 by , 17 years ago
I'm seeing the same issues on my athlon64, albeit I can't even make it through the boot process without hitting it.
comment:8 by , 17 years ago
| Resolution: | → fixed |
|---|---|
| Status: | reopened → closed |
comment:9 by , 17 years ago
i tested again after hrev24742 now i get this:
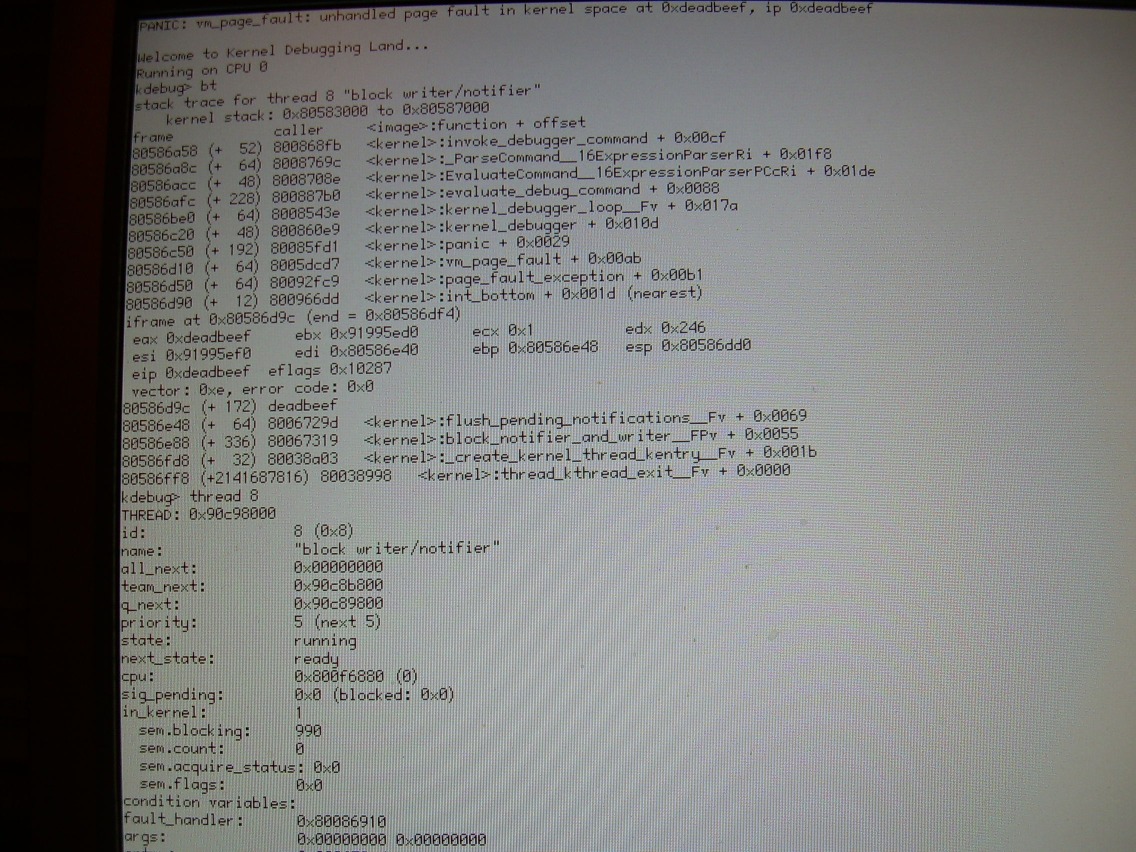
where
stack trace for thread 9 "block writer/notifier"
    kernel stack: 0x80188000 to 0x8018c000
frame            caller     <image>:function + offset
8018ba58 (+  52) 80085d17   <kernel>:invoke_debugger_command + 0x00cf
8018ba8c (+  64) 80086ab8   <kernel>:_ParseCommand__16ExpressionParserRi + 0x01f8
8018bacc (+  48) 800864aa   <kernel>:EvaluateCommand__16ExpressionParserPCcRi + 0x01de
8018bafc (+ 228) 80087bcc   <kernel>:evaluate_debug_command + 0x0088
8018bbe0 (+  64) 8008485a   <kernel>:kernel_debugger_loop__Fv + 0x017a
8018bc20 (+  48) 80085505   <kernel>:kernel_debugger + 0x010d
8018bc50 (+ 192) 800853ed   <kernel>:panic + 0x0029
8018bd10 (+  64) 8005d9b7   <kernel>:vm_page_fault + 0x00ab
8018bd50 (+  64) 800923e5   <kernel>:page_fault_exception + 0x00b1
8018bd90 (+  12) 80095aed   <kernel>:int_bottom + 0x001d (nearest)
iframe at 0x8018bd9c (end = 0x8018bdf4)
 eax 0xdeadbeef     ebx 0x9145e240      ecx 0x1          edx 0x246
 esi 0x9145e260     edi 0x8018be40      ebp 0x8018be48   esp 0x8018bdd0
 eip 0xdeadbeef  eflags 0x10287
 vector: 0xe, error code: 0x0
8018bd9c (+ 172) deadbeef
8018be48 (+  64) 80066f7d   <kernel>:flush_pending_notifications__Fv + 0x0069
8018be88 (+ 336) 80066ff9   <kernel>:block_notifier_and_writer__FPv + 0x0055
8018bfd8 (+  32) 800386e3   <kernel>:_create_kernel_thread_kentry__Fv + 0x001b
8018bff8 (+2145861640) 80038678   <kernel>:thread_kthread_exit__Fv + 0x0000
kdebug>
comment:10 by , 17 years ago
kdebug> thread 9
THREAD: 0x90a69800
id:                 9 (0x9)
name:               "block writer/notifier"
all_next:           0x00000000
team_next:          0x90a5f000
q_next:             0x90a5b800
priority:           5 (next 5)
state:              running
next_state:         ready
cpu:                0x800f6ab4 (1)
sig_pending:        0x0 (blocked: 0x0)
in_kernel:          1
  sem.blocking:     39398
  sem.count:        0
  sem.acquire_status: 0x0
  sem.flags:        0x0
condition variables:
fault_handler:      0x80085d2c
args:               0x00000000 0x00000000
entry:              0x80066fa4
team:               0x90a36780, "kernel_team"
  exit.sem:         183
  exit.status:      0x0 (No error)
  exit.reason:      0x0
  exit.signal:      0x0
  exit.waiters:
kernel_stack_area:  84
kernel_stack_base:  0x80188000
user_stack_area:    -1
user_stack_base:    0x00000000
user_local_storage: 0x00000000
kernel_errno:       0x0 (No error)
kernel_time:        716567
user_time:          0
flags:              0x0
architecture dependant section:
        esp: 0x8018bb38
        ss: 0x80180010
        fpu_state at 0x90a69b60
kdebug>
follow-up: 13 comment:11 by , 17 years ago
| Resolution: | fixed |
|---|---|
| Status: | closed → reopened |
Great, looks like I can't do anything right :-) Can you please add the KDL message? (you can always later retrieve it in KDL with the "message" command) How did you produce this crash? What did you do? SMP?
comment:12 by , 17 years ago
Just FYI, I didn't get any errors again and I compiled Haiku inside itself from start to finish. Other than some mimeset bugs I am seeing, everything worked.
comment:13 by , 17 years ago
Replying to axeld:
Great, looks like I can't do anything right :-)
Of course, you can, with a small extra help :-)
Can you please add the KDL message? (you can always later retrieve it in KDL with the "message" command)
i just reboot before i read your message, the big problem now is that i 'lost' the partition:
bfs: Replay log, disk was not correctly unmounted...
run count: -1, array max: -2, max runs: 126
bfs: Log entry has broken header!
bfs: replaying log entry from 820 failed: Bad data
bfs: could not initialize journal: General system error!
bfs: bfs_mount:120: General system error
that partition had all the source tree, and was initialized from hrev5 Should i try to mount from hrev5? any ideas? no worries, i love this sport, and i am prepared for these kind of emotions :-)
How did you produce this crash? What did you do?
'svn up' now we will have a test of a full 'svn up', i guess :-)
SMP?
the hyperthreading cpu (P4 3Ghz) HT
May i ask what kinds of information shall be traced (enabled) in tracing_config.h if any?
comment:14 by , 17 years ago
I just saw this crash on hrev24788 after doing a complete svn checkout. See attached screenshot. This was on a single CPU Athlon64 2GHz w/ 1GB of RAM.
comment:15 by , 17 years ago
| Resolution: | → fixed |
|---|---|
| Status: | reopened → closed |
Should finally be fixed again in hrev24792.
comment:16 by , 17 years ago
There seems to be a deadlock now. Unzipping Haiku sources inside Haiku reached a point where it simply stopped. I can still move the mouse around but I can not do any disk operations. I can not also stop the unzip process with CTRL+C. Should I open a new bug for this?
comment:17 by , 17 years ago
Has it been fixed with hrev24793 by any chance? Have you seen where the threads were waiting? If it just sit in wait_for_notifications() it should have been that bug.
comment:19 by , 17 years ago
Unfortunately, I am still getting i/o system lock ups with 24793. I was using BePDF when any app suddenly froze that was trying to read/write from disk.
comment:20 by , 17 years ago
| Resolution: | fixed |
|---|---|
| Status: | closed → reopened |
I experienced this as well on shutdown..."Tidying things up" hung forever, and the dialog was uncancellable.
follow-up: 23 comment:21 by , 17 years ago
Further note, I just encountered it again while doing an svn checkout, and checked the threads involved...
The svn thread is blocked on the "bfs journal" sem, with a count of -4, while the page writer is blocked on a sem called page writer with a count of -1. Is there any easy way to list all the threads blocking on a particular sem without looking through the entire thread list?
comment:22 by , 17 years ago
A little more info I dug up: The low memory handler thread is likewise blocked on the bfs journal sem, and the block notifier is waiting on the "cache transaction sync" cvar, along with 8 other threads if I understand the kernel debugger's output about the var properly.
comment:23 by , 17 years ago
Replying to anevilyak:
Is there any easy way to list all the threads blocking on a particular sem without looking through the entire thread list?
"sem" prints the queue of waiting threads under "queue:".
follow-up: 25 comment:24 by , 17 years ago
Glad I left that debugger open in that case :)
id: 991 (0x3df) name: 'bfs journal' owner: 1 count: -4 queue: 276 6 181 170 last acquired by: 8, count: 1 last released by 276, count: 1
8 = block writer/notifier, waiting on the cache transaction sync cv 276 = svn 6 = low memory handler 181 = TrackerTaskLoop 170 = Terminal window thread
comment:25 by , 17 years ago
Replying to anevilyak:
Glad I left that debugger open in that case :)
I haven't looked at Axel's latest changes to the block cache, but if you still have the debugger open, stack traces for the 5 potentially involved threads (8, 276, 6, 181, 170) should help to understand the deadlock.
comment:26 by , 17 years ago
I'm leaving that box in the kernel debugger until I'm asked to try a change :) I can't get anything useful done in Haiku because of that deadlock anyways, so I may as well leave it so I can pull as much useful information about that state as possible. In any case, traces:
thread 8 - <kernel>:context_switchFP6threadT0 <kernel>:scheduler_reschedule <kernel>:Wait29PrivateConditionVariableEntryUl <kernel>:wait_for_notificationsFP11block_cache <kernel>:cache_sync_transaction <bfs>:_WriteTransactionToLog7Journal <bfs>:_FlushLog7JournalbT1 <bfs>:_TransactionListener7JournalllPv <kernel>:flush_pending_notificationsFP11block_cache <kernel>:flush_pending_notificationsFv <kernel>:block_notifier_and_writerFPv <kernel>:_create_kernel_thread_kentry_Fv <kernel>:thread_kthread_exit_Fv
thread 276: <kernel>context_switchFP6ThreadT0 <kernel>:scheduler_reschedule <kernel>:switch_sem_etc <kernel>:acquire_sem_etc <bfs>:Lock7JournalP11Transaction <bfs>:Start11TransactionP6Volumex <bfs>:WriteAt5InodeR11TransactionxPCUcPUl <bfs>:bfs_writeFPvN20xPCvPUl <kernel>:file_writeFP15file_descriptorxPCvPUl <kernel>:common_user_ioFixPvUlb <kernel>:_user_write <kernel>:pre_syscall_debug_done iframe at 0x94b03fa8 (end = 0x94b04000) eax 0x70 ebx 0x460074 ecx 0x7ffe66dc edx 0xffff0104 esi 0x1a48e3b0 edi 0x19f022d8 ebp 0x7ffe6718 esp 0x94b03fdc eip 0xffff0104 eflags 0x203 vector: 0x63, error code: 0x0 <libapr-1.so>:apr_file_write <snip>lots of layers in APR/LibSVN that I assume is irrelevant here.
thread 6: <kernel>:context_switchFP6threadT0 <kernel>:scheduler_reschedule <kernel>:switch_sem_etc <kernel>:acquire_sem_etc <bfs>:Lock7JournalP11Transaction <bfs>:Start11TransactionP6Volumex <bfs>:bfs_put_vnodeFPvT0b <kernel>:free_vnodeFP5vnodeb <kernel>:dec_vnode_ref_countFP5vnodeb <kernel>:vnode_low_memoy_handlerFPvl <kernel>:call_handlersFl <kernel>:low_memoryFPv <kernel>:_create_kernel_thread_kentryFv <kernel>:thread_kthread_exitFv
thread 181: <kernel>:context_switchFP6threadT0 <kernel>:scheduler_reschedule <kernel>:switch_sem_etc <kernel>:acquire_sem_etc <bfs>:Lock7JournalP11Transaction <bfs>:Start11TransactionP6Volumex <bfs>:bfs_put_vnodeFPvT0b <kernel>:free_vnodeFP5vnodeb <kernel>:dec_vnode_ref_countFP5vnodeb <kernel>:fix_direntFP5vnodeP6direntP10io_context <kernel>:dir_readFP10io_contextP5vnodePvP6direntUlPUl <kernel>:dir_readFP10io_contextP15file_descriptorP6direntUlPUl <kernel>:_user_read_dir <kernel>:pre_syscall_debug_done iframe at 0x94960fa8 (end = 0x94961000) eax 0x73 ebx 0x42c818 ecx 0x70206be0 edx 0xffff0104 esi 0x70206c40 edi 0x18117f78 ebp 0x70206c0c esp 0x94960fdc eip 0xffff0104 eflags 0x246 vector: 0x63 error code: 0x0 <libbe.so>:GetNextRef10BDirectoryP9entry_ref + 0x008e <snip>
thread 170: <kernel>:context_switchFP6threadT0 <kernel>:scheduler_reschedule <kernel>:switch_sem_etc <kernel>:acquire_sem_etc <bfs>:Lock7JournalP11Transaction <bfs>:Start11TransactionP6Volumex <bfs>:bfs_put_vnodeFPvT0b <kernel>:free_vnodeFP5vnodeb <kernel>:dec_vnode_ref_countFP5vnodeb <kernel>:dir_free_fdFP15file_descriptor <kernel>:put_fd <kernel>:common_close <kernel>:_user_close <kernel>:pre_syscall_debug_done iframe at 0x947a9fa8 (end = 0x947aa000) eax 0x77 ebx 0x45f818 ecx 0x700c12e0 edx 0xffff0104 esi 0x700c15bc edi 0x700c15bc ebp 0x700c130c esp 0x947a9fdc eip 0xffff0104 eflags 0x207 vector: 0x63, error code: 0x0 <libbe.so>:_._6BEntry <libbe.so>:_TranslateRefC7BRosterB9entry_refP9BMimeTypeT1P5BFilePb <snip>
Let me know if you need me to pull any other info out.
comment:27 by , 17 years ago
I would have preferred opening another ticket for this bug as it has nothing to do with the original bug. Anyway, the stack crawl of thread 8 (the block writer/notifier) looks indeed very helpful; I forgot that it may call cache_sync_transaction() itself, too.
comment:28 by , 17 years ago
| Resolution: | → fixed |
|---|---|
| Status: | reopened → closed |
Should be fixed in hrev24806. If not, let's open a new ticket this time.
Thanks! Fixed in hrev24749.